User’s Guide 11974 Series Preselected Millimeter Mixers Manufacturing Part Number: 11974-90012 Supersedes 11974-90010 Printed in USA October 2003 © Copyright 1992, 1999, 2001, 2002, 2003 Agilent Technologies, Inc.
Notice The information contained in this document is subject to change without notice. Agilent Technologies makes no warranty of any kind with regard to this material, including but not limited to, the implied warranties of merchantability and fitness for a particular purpose. Agilent Technologies shall not be liable for errors contained herein or for incidental or consequential damages in connection with the furnishing, performance, or use of this material.
LIMITATION OF WARRANTY The foregoing warranty shall not apply to defects resulting from improper or inadequate maintenance by Buyer, Buyer-supplied software or interfacing, unauthorized modification or misuse, operation outside of the environmental specifications for the product, or improper site preparation or maintenance. NO OTHER WARRANTY IS EXPRESSED OR IMPLIED. AGILENT TECHNOLOGIES SPECIFICALLY DISCLAIMS THE IMPLIED WARRANTIES OF MERCHANTABILITY AND FITNESS FOR A PARTICULAR PURPOSE.
Contents 1. General Information Introduction . . . . . . . . . . . . . . . . . . . . . . . . . . . . . . . . . . . . . . . . . . . . . . . . . . . . . . . . . . . . . . . . . 8 What You’ll Find in this Chapter . . . . . . . . . . . . . . . . . . . . . . . . . . . . . . . . . . . . . . . . . . . . . . . . 9 11974 Series Preselected Millimeter Mixers Overview . . . . . . . . . . . . . . . . . . . . . . . . . . . . . . 10 Options Available . . . . . . . . . . . . . . . . . . . . . . . . . . . . . . . . . . .
Contents General Descriptions of 71000 Series Spectrum Analyzer External-Mixing Functions . . .67 Conversion Loss Versus Frequency Correction . . . . . . . . . . . . . . . . . . . . . . . . . . . . . . . . . . .69 Using 8563A, 8561B, 8560A, or 8560 E/EC-Series Spectrum Analyzers . . . . . . . . . . . . . . . .71 Preliminary Operation . . . . . . . . . . . . . . . . . . . . . . . . . . . . . . . . . . . . . . . . . . . . . . . . . . . . . .71 Operation . . . . . . . . . . . . . . . . . . . . . . . . . . . .
General Information 1 General Information 7
General Information General Information Introduction Introduction The 11974 Series Preselected Millimeter Mixers Installation, Verification, and Operation Manual describes how to configure an 11974 in a system, what to do to verify its performance, and how to operate an 11974. This manual contains the following chapters: • Chapter 1, “General Information,” provides a quick overview of the 11974 Series Preselected Millimeter Mixer and all operating specifications and characteristics tables.
What You’ll Find in this Chapter This chapter introduces you to the 11974 Series Preselected Millimeter Mixers and provides other general information regarding the 11974 Series. This chapter contains the following topics: • “11974 Series Preselected Millimeter Mixers Overview” on page 10. • “Accessories Supplied” on page 11. • “Specifications and Characteristics” on page 14. • “Calibration Cycle” on page 13.
General Information General Information 11974 Series Preselected Millimeter Mixers Overview 11974 Series Preselected Millimeter Mixers Overview The 11974 Series Preselected Millimeter Mixers are preselected RF front-end sections used to extend the frequency range of the Agilent Technologies high performance, portable, and modular spectrum analyzers. The 11974 Series are fully calibrated, system compatible, and cover a frequency range from 26.5 to 75 GHz in four waveguide bands — A, Q, U, and V.
Options Available Input Isolator (Option 001) This option provides an 11974 Series Preselected Millimeter Mixer that has been calibrated with an isolator attached to the RF input. The addition of the isolator improves input match, reducing measurement uncertainties and protects the device under test (DUT) from off-resonant reflections from the input tracking filter. Accessories Supplied The following is a list of all accessories, and their part numbers, supplied at shipment.
General Information General Information Serial Numbers Covered by This Manual Serial Numbers Covered by This Manual This manual applies to 11974 Series Preselected Millimeter Mixers with the serial number prefixes 3001A and above. Agilent Technologies makes frequent improvements to its products to enhance their performance, usability, or reliability. Agilent Technologies service personnel have access to complete records of design changes to each type of equipment, based on the equipment’s serial number.
Calibration Cycle Use the performance tests in Chapter 4 every 12 months to check the unit against the specifications listed in Table 1-1 on page 15.
General Information General Information Specifications and Characteristics Specifications and Characteristics Table 1-1 lists the specifications for the 11974 Series Preselected Millimeter Mixers. Unless stated otherwise, all specifications describe the warranted performance of the 11974 under the following conditions: • Five minute warm-up for ambient conditions. • Ambient temperature 0°C to 55°C. • One year calibration cycle. • Environmental requirements met.
Table 1-1 11974 Specifications FREQUENCY Frequency Range (LO Harmonic Number) 11974A (n = 8) 11974Q (n = 10) 11974U (n = 10) 11974V (n = 14) 26.5 GHz 33 GHz 40 GHz 50 GHz to to to to 40 GHz 50 GHz 60 GHz 75 GHz RF Preselector Bandwidth (3 dB points) 11974A 11974Q 11974U 11974V Typical Min.
General Information General Information Specifications and Characteristics Table 1-1 11974 Specifications (Continued) Conversion Loss RF to IF port (includes 1 m IF cable, part number 5061-5458) 11974A 11974Q 11974U 11974V 44 dB max. 46 dB max. 43 dB max. 57 dB max. RF Input Match (across full waveguide band) Option 001 only 11974A, Q, U 11974V <1.6:1 <2.3:1 Conversion Loss Chart Accuracy 20°C to 30°C: RSS of calibration equipment errors (Add 0.
Table 1-1 11974 Specifications (Continued) Multiple Response a (Due to in-range applied signals mixing with LO harmonics other than order N) 11974A (N = 8) 11974Q (N = 10) 11974U (N = 10) 11974V (N = 14) (applied signal: 50 to 67 GHz) 11974V (N = 14) (applied signal: 67 to 75 GHz) −63 dBc max. −60 dBc max. −60 dBc max. −60 dBc max. −55 dBc max. a. Multiple response displayed frequency, f ′RF, due to input signal f RF.
General Information General Information Specifications and Characteristics Table 1-1 11974 Specifications (Continued) GENERAL SPECIFICATIONS Environmental Specifications Type tested to MIL-T-28800C, Class 5 environmental conditions as listed below: Temperature Non-operating Operating −40°C to +75°C 0°C to +55°C Relative Humidity 95% ±5% up to +30°C Altitude Non-operating Operating <12,195 m (<40,000 feet) <3,048 m (<10,000 feet) Maximum Vibration Level 5 Hz to 55 Hz 2g Maximum Shock 30 g Elect
Table 1-2 11974 Characteristics Note: These are not specifications. Characteristics provide useful, but nonwarranted information about instrument performance. FREQUENCY Center Frequency Accuracy Residual FM Using Table 1-1, “11974 Specifications,” for the spectrum analyzer being used, evaluate these characteristics with reference to the harmonic numbers listed below. Span Accuracy 11974A (n = 8) 26.
General Information General Information Specifications and Characteristics Table 1-2 11974 Characteristics (Continued) AMPLITUDE MEASUREMENT RANGE (continued) IF Subharmonic Response Intercept (2nd Order) (Response at fIF/2 above input signal) fIF/2 = 160.7 MHz (8566B, 71000C, PSA Series) = 155.35 MHz (8560 Series Portable Spectrum Analyzer) 11974A 11974Q 11974U 11974V +45 dBm min. +45 dBm min. +45 dBm min. +30 dBm min.
Table 1-2 11974 Characteristics (Continued) INPUTS AND OUTPUTS (continued) IF Output Connector Type SMA (f) Match <1.6:1 (50Ω) Bandwidth Nominal >100 MHz Typical >150 MHz (Total 11974 BW limited by preselector.) Tune + Span Input Connector Type BNC (f) Sensitivity (Spectrum Analyzer Type) (PSEL PK DAC at mid-value) 8566B/11975A 8560 Series Portable Spectrum Analyzer 71000/70907B, E4407B, PSA Series Input Impedance −2 V/GHz × fLO − 0.32 V +1.5 V/GHz × fLO − 0.21 V +1.5 V/GHz × fLO V 20 kΩ min.
General Information General Information Specifications and Characteristics GENERAL CHARACTERISTICS Weight 11974 Series 14.3 kg (6.5 lb) 11974-60028 Preselector Power Supply 26.2 kg (11.9 lb) Length (A) × Width (B) × Height (C) Size 11974 Series 210.2 mm × 84.7 mm × 101.5 mm 11974-60028 Preselector Power Supply 346.1 mm × 212.7 mm × 133.
Figure 1-3 11974A Minimum System Dynamic Range Chapter 1 23 General Information General Information Specifications and Characteristics
General Information General Information Specifications and Characteristics Figure 1-4 11974Q Minimum System Dynamic Range 24 Chapter 1
Figure 1-5 11974U Minimum System Dynamic Range Chapter 1 25 General Information General Information Specifications and Characteristics
General Information General Information Specifications and Characteristics Figure 1-6 11974V Minimum System Dynamic Range 26 Chapter 1
Installation 2 Installation 27
Installation What You’ll Find in This Chapter What You’ll Find in This Chapter This chapter describes how to set up an 11974 Series Preselected Millimeter Mixer for operation. This chapter contains the following topics.
Installation Spectrum Analyzer Compatibility Spectrum Analyzer Compatibility The 11974 Series mixers are compatible with the spectrum analyzers listed in the following table. Table 2-1.
Installation Spectrum Analyzer Compatibility Table 2-1. 11974 Compatibility with Spectrum Analyzers PSA SERIES SPECTRUM ANALYZER Note: E4443A and E4445A do not support external mixing.
Installation Initial Inspection Initial Inspection Inspect the shipping container upon receipt. Retain it and the cushioning materials. If the container or cushioning material is damaged, verify that the contents are complete and that the unit functions correctly both mechanically and electrically. If the contents are incomplete or the 11974 fails the performance tests in Chapter 4, “Performance Tests,” on page 97, notify one of the Agilent Technologies Sales and Service Offices listed on page 45.
Installation Preparing the 11974 for Use Preparing the 11974 for Use When installing equipment, ensure that the 11974-60028 Power Supply ac power switch and the power cord are easily accessible to allow for disconnecting the equipment from the mains power supply. The power switch will remove power from the 11974, but the power must be disconnected to remove the 11974-60028 from the mains power supply.
Installation Preparing the 11974 for Use Power Requirements The power requirements for the 11974 are listed below. Table 2-2 Operating Power Requirements Line Input Power Requirements 100/120 V ac Operation 220/240 V ac Operation Line Voltage 100 V to 120 V, ±10% 220 V to 240 V, ±10% Line Current 1 A rms max. 0.5 A rms max. Line Frequency 47 Hz to 66 Hz 47 Hz to 66 Hz This is a Safety Class I product (provided with a protective earthing ground incorporated in the power cord).
Installation Preparing the 11974 for Use Installation Figure 2-1 Voltage Selection Switch and Line Fuse Locations Checking the Fuse The type of ac-line input fuse depends on the input-line voltage. Use the following fuses: 100 V to 120 V Operation: 1 A 250 V UL/CSA (TIME DELAY) (part number 2110-0674) (for use in the United States) 220 V to 240 V Operation: 0.
Installation Preparing the 11974 for Use Power Cable The 11974-60028 Preselector Power Supply is equipped with a three-wire power cable, in accordance with international safety standards. When connected to an appropriate power-source outlet, this cable grounds the instrument cabinet. WARNING Various power cables are available to connect the power supply to the types of ac power outlets unique to specific geographic areas.
Installation Preparing the 11974 for Use Table 2-3. Power Cables Plug Type a Cable Part Number Plug b Description Length cm (in.
Installation Preparing the 11974 for Use Table 2-3. Power Cables (Continued) Plug Type a Cable Part Number Plug b Description Length cm (in.
Installation Preparing the 11974 for Use Using a Conversion-Loss Data Disk with the ESA or PSA Series Analyzers The conversion-loss data for your mixer can be quickly loaded in the memory of an ESA or PSA series analyzer from a floppy disk. The following process works with the floppy disk provided by the factory with your new mixer, or with one that you have stored the correction data. This process eliminates the time consuming and sometimes error-prone process of manually entering the data from a table.
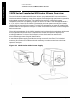
Installation Electrostatic Discharge Information Electrostatic Discharge Information Electrostatic discharge (ESD) can damage or destroy electronic components. Therefore, all work performed on assemblies consisting of electronic components should be done at a static-safe workstation. Figure 2-2 shows an example of a static-safe workstation. Two types of ESD protection are shown: (a) conductive table mat and wrist strap combination, and (b) conductive floor mat and heel strap combination.
Installation Electrostatic Discharge Information Reducing ESD Damage The following are suggestions that may help reduce the amount of ESD damage that can occur during testing and servicing instruments. PC Board Assemblies and Electronic Components • Handle these items at a static-safe workstation. • Store or transport these items in static-shielding containers. Installation CAUTION Do not use erasers to clean the edge-connector contacts.
Installation Electrostatic Discharge Information Static-Safe Accessories Table 2-4 Static-Safe Accessories Description 9300-0797 Set includes: 3M static control mat 0.6 m × 1.2 m (2 ft × 4 ft) and 4.6 cm (15 ft) ground wire. (The wrist-strap and wrist-strap cord are not included. They must be ordered separately.) 9300-0980 Wrist-strap cord 1.5 m (5 ft) 9300-1383 Wrist-strap, color black, stainless steel, without cord, has four adjustable links and a 7 mm post-type connection.
Installation Returning Equipment for Service Returning Equipment for Service Repackaging equipment requires original shipping containers and materials or their equivalents. Agilent Technologies offices can provide packaging materials identical to the original. Figure 2-3 on page 43 and Figure 2-4 on page 44 identify the original packaging materials and their part numbers. When ordering packaging materials, it is necessary to order the proper number of foam inserts.
Installation Returning Equipment for Service 3. Seal the shipping container securely with strong nylon adhesive tape. 4. Mark the shipping container “FRAGILE, HANDLE WITH CARE” to ensure careful handling. 5. Retain copies of all shipping papers.
Installation Returning Equipment for Service Installation Figure 2-4 Packaging Materials for 11974-60028 Power Supply Item Qty Part Number Description 1 1 9211-4893 Corrugated Outer Carton 2 1 5180-7809 Foam Pads (set) 3 1 9220-4421 Corrugated Sleeve Sales and Service Offices Agilent Technologies Sales and Service Offices provide worldwide support for Agilent Technologies products. To obtain servicing information or to order replacement parts, contact the nearest office listed on page 45.
Installation Returning Equipment for Service Table 2-5. Contacting Agilent Online assistance: www.agilent.
Installation Installation Returning Equipment for Service 46 Chapter 2
Operation 3 Operation 47
Operation What You’ll Learn in this Chapter What You’ll Learn in this Chapter This chapter introduces you to basic preselected external-mixing functions available using an 11974 Series Preselected Millimeter Mixer. After a brief discussion of operating precautions and hints, operation procedures using the most commonly-used “host” spectrum analyzers are described.
Operation What You’ll Learn in this Chapter Operation for Each Spectrum Analyzer Band Selection describes how to select the desired millimeter band for operation. Amplitude Calibration allows you to enter in conversion-loss values for your specific operating frequency. Each 11974 band is individually characterized and labeled at the factory with a calibration chart of its conversion loss versus frequency. Preselector Peaking or Centering quickly maximizes the amplitude accuracy of a signal of interest.
Operation 11974Q Front-Panel Features 11974Q Front-Panel Features Operation Figure 3-1. 11974Q Front Panel The front panel of an 11974 Series mixer consists of an RF input port flange and two flange clamps. The following table lists the RF input port flange types. Table 3-1. RF Input Port Flange Types Model Size Flange Type 11974Aa WR-28 UG599/U 11974Qa WR-22 UG383U 11974Ua WR-19 UG383/U-M 11974Va WR-15 UG385U a. Refer to Table 1-2 for the ratings of these input and output connectors.
Operation 11974Q Rear-Panel Features 11974Q Rear-Panel Features Figure 3-2. 11974Q Rear Panel receives power from the 11974-60028 Preselector Power Supply.a INSTRUMENT SELECT switches allow the 11974 to properly scale the tune ramp of the specified spectrum analyzer. IF OUT requires an SMA type cable and supplies the IF INPUT for the spectrum analyzer. a TUNE IN requires a BNC type cable and receives the TUNE + SPAN sweep output from the spectrum analyzer.
Operation 11974-60028 Front-Panel Features 11974-60028 Front-Panel Features Figure 3-3. 11974-60028 Front Panel provides power for the 11974 Preselector RF Mixer. LINE switch applies power to the OUTPUT PRESELECTOR POWER jack.
Operation Operating Precautions Operating Precautions CAUTION To avoid damaging your 11974 and to assure accurate measurements, be sure to follow the recommendations in this section. Maximum RF Input Level The maximum RF input level, as stated in Table 1-2 on page 19, is +25 dBm CW, Peak, or Average. However, since the 1 dB compression point at the RF input is between 0 and +6 dBm depending on the band, meaningful measurements will end long before the damage level is reached.
Operation Operating Hints Operating Hints The following operating hints are provided for your convenience. Preventing Erroneous Preselector Peaking or Centering During Spur Searches When performing spurious response tests on a device under test (DUT), the spectrum to be measured typically contains both large and small signals. If the spurs are smaller than −60 to −65 dBc, they may be confused with the image or multiple response of the large signal.
Operation Operating Hints Remote Location of an 11974 In cases where the device-under-test (DUT) is farther away than the 1 meter LO and IF cables can accommodate, place the 11974 close to the DUT, but place the host spectrum analyzer the desired distance away. In order to preserve the excellent amplitude accuracy of the 11974, the +14.5 to 16 dBm LO power must be supplied even though the LO cables may become quite long. To supply the LO power, insert an 11975A Amplifier at the 11974 location.
Operation Operating Hints Operation Figure 3-4.
Operation Operating Hints RF Port Voltage Standing Wave Ratio (VSWR) Effects As with most bandpass filters, the magnetically tunable Barrium-Ferrite bandpass filter of the 11974 is reflective out of its passband. In addition, the 11974 does not have a programmable RF port attenuator to improve the VSWR in band or out of band. This may cause measurement errors when testing VSWR sensitive DUTs outside of their operating frequency range.
Operation Using an 8566B Spectrum Analyzer Using an 8566B Spectrum Analyzer Preliminary Operation Compatibility Reference Refer to Chapter 2, “Installation,” on page 27 for information relating to retrofit requirements for 8566A and older 8566B Spectrum Analyzers. Equipment Connection Connect the equipment as shown in Figure 3-5. on page 59 and use the following checklist to verify the connections.
Operation Using an 8566B Spectrum Analyzer Figure 3-5. 11974 Connections Using an 8566B Operation Frequency Tracking Calibration Use this procedure to align the frequency of the 11974 tracking filter to the tuned frequency of the 8566B. Fo0llow this procedure anytime the 11974 is connected to a different spectrum analyzer. Periodically check the calibration. 1.
Operation Using an 8566B Spectrum Analyzer 3. On the spectrum analyzer, set the preselector DAC to 32 (the center of its 0–63 range) by pressing SHIFT, GHz, 32, and Hz. 4. Set the spectrum analyzer to a frequency span of 0 Hz by pressing FREQUENCY, SPAN, 0, and Hz. NOTE Due to the repetitive nature of this procedure, it may be helpful to save the center-frequency settings as indicated in steps 5 and 7 in unused state registers. 5.
Operation Using an 8566B Spectrum Analyzer Operation Band Selection 1. If necessary, mate the 11974 to the spectrum analyzer being used for preselected external mixing by using the Frequency Tracking Calibration procedure above. 2.
Operation Using an 8566B Spectrum Analyzer Operation General Descriptions of 8566B External-Mixing Functions SHIFT, ⇑ selects the first millimeter frequency “lettered” band, K-band (18 – 26.5 GHz). (Note: K-band is not available in the 11974 Series.) Each succeeding press of the ⇑ key advances to the next lettered band. For example, A band can be displayed by pressing SHIFT ⇑ ⇑. The lettered bands are paired with harmonic numbers.
Using an 71000 Series Spectrum Analyzer Operation with an 70907B, 70909A, or 70910A Using an 71000 Series Spectrum Analyzer with an 70907B, 70909A, or 70910A Preliminary Operation NOTE This section provides information for the 70907B, however the operation of the 70909A and 70910A is similar. Minor differences may be noted, but the necessary deviations from these exact instructions will be obvious.
Operation Using an 71000 Series Spectrum Analyzer with an 70907B, 70909A, or 70910A Frequency Tracking Calibration Use this procedure to align the frequency of the 11974 tracking filter to the tuned frequency of the spectrum analyzer. Follow this procedure whenever the 11974 is connected to a different spectrum analyzer. Periodically check the calibration. 1.
Using an 71000 Series Spectrum Analyzer Operation with an 70907B, 70909A, or 70910A 6. To adjust the tracking between the 71000 and the 11974, perform the following steps: a. Set the spectrum analyzer center frequency by pressing Freq and CENTER and entering the corresponding start frequency value for the mixer listed below, then save this setting in an unused register. for an 11974A: 26.5 GHz for an 11974Q: 33.0 GHz for an 11974U: 40.0 GHz for an 11974V: 50.0 GHz b.
Operation Using an 71000 Series Spectrum Analyzer with an 70907B, 70909A, or 70910A Operation Band Selection 1. If necessary, mate the 11974 to the spectrum analyzer being used for preselected external mixing by using the procedure “Frequency Tracking Calibration” on page 64. 2. Use the following key sequence to enter the external mixing mode and to select the desired band of operation. MENU State ext mixer fulband KAQUVE Press the softkey for the desired band.
Using an 71000 Series Spectrum Analyzer Operation with an 70907B, 70909A, or 70910A Preselector Peaking 1. Place the active marker on the desired signal to be peaked. Hint: To complete the preselector-peaking routine more quickly, place the signal at center screen and reduce the frequency span until the sweep time is approximately 100 ms. 2. Peak the desired signal by using the following key sequence.
Operation Using an 71000 Series Spectrum Analyzer with an 70907B, 70909A, or 70910A Table 3-2. External Mixing Bands and Associated Mixing Harmonics Band Harmonic Number (N) Frequency Range (GHz) F 24+ 90.0 to 140.0 D 30+ 110.0 to 170.0 G 36+ 140.0 to 220.0 Y 42+ 170.0 to 260.0 J 50+ 220.0 to 330.0 (conversion loss) offsets the reference level to compensate for amplitude losses at the active input port.
Using an 71000 Series Spectrum Analyzer Operation with an 70907B, 70909A, or 70910A Conversion Loss Versus Frequency Correction The 71000 Series Spectrum Analyzers with the 70907B External Mixer Interface Module installed has the amplitude-correction function (AMPCOR) available by remote programming. Use AMPCOR to compensate for the 11974 frequency-dependent conversion-loss variations.
Operation Using an 71000 Series Spectrum Analyzer with an 70907B, 70909A, or 70910A To print out an existing AMPCOR table, use the program listed below. 10 20 30 40 50 60 70 80 90 100 110 DIM A$(1:20)[30] OUTPUT 718;"CNVLOSS 0DB;" OUTPUT 718;"AMPCOR 50GHZ, 46.1DB, 52GHZ, 46.7DB, 53GHZ,47.2DB;" ! OUTPUT 718;"AMPCOR?;" ENTER 718 USING "%,K";A$(*) ! FOR I=1 TO 10 PRINT "Point ";I,A$(I) NEXT I END Line 30: Generates an AMPCOR table. Line 60: % specifies that an EOI terminates the entire statement.
Operation Using 8563A, 8561B, 8560A, or 8560 E/EC-Series Spectrum Analyzers Using 8563A, 8561B, 8560A, or 8560 E/EC-Series Spectrum Analyzers NOTE External mixing cannot be performed on instruments with Option 002 Tracking Generator. Preliminary Operation Compatibility Reference Refer to Chapter 1, “General Information,” on page 7 for information relating to retrofit requirements for 8561B and 8560A Spectrum Analyzers. Equipment Connections Connect the equipment as shown in Figure 3-7.
Operation Using 8563A, 8561B, 8560A, or 8560 E/EC-Series Spectrum Analyzers Frequency Tracking Calibration Use this procedure to align the frequency of the 11974 tracking filter to the tuned frequency of the spectrum analyzer Follow this procedure anytime the 11974 is connected to a different spectrum analyzer. Periodically check the calibration. 1.
Operation Using 8563A, 8561B, 8560A, or 8560 E/EC-Series Spectrum Analyzers 8. Set the spectrum analyzer center frequency by pressing FREQUENCY, CENTER FREQ and entering the corresponding value for the mixer listed below: for an 11974A: 40 GHz for an 11974Q: 50 GHz for an 11974U: 60 GHz for an 11974V: 75 GHz 9.
Operation Using 8563A, 8561B, 8560A, or 8560 E/EC-Series Spectrum Analyzers 12.Change the spectrum analyzer center frequency to the value indicated below, then save this setting in an unused register: for an 11974A: 40 GHz for an 11974Q: 50 GHz for an 11974U: 60 GHz for an 11974V: 75 GHz 13.On the rear-panel of the 11974, adjust the corresponding potentiometer for the mixer listed below until one or both of the green LEDs are lit.
Operation Using 8563A, 8561B, 8560A, or 8560 E/EC-Series Spectrum Analyzers Amplitude Calibration Enter the conversion loss table at the preset frequencies from either the calibration label on the bottom of the 11974 or the supplied calibration sheet by using the following key sequence. (Note: the analyzer automatically interpolates between the preset frequencies.
Operation Using 8563A, 8561B, 8560A, or 8560 E/EC-Series Spectrum Analyzers General Description of External-Mixing Functions selects either preselected external mixing mode or unpreselected external mixing mode. This softkey sets the external mixer configuration used by the softkey menu found under the EXTERNAL MIXER softkey under AUX CTRL. CONFIG, EXT MXR PRE UNPR If the preselected external mixer mode is selected, rear-panel output J8 of the analyzer is automatically switched to provide an output of 1.
Operation Using 8563A, 8561B, 8560A, or 8560 E/EC-Series Spectrum Analyzers displays the stored conversion loss for a specific frequency in the current band. This allows amplitude correction to be entered to compensate for changes in conversion loss with frequency. To enter a new value, use the data keys. To change the displayed frequency, use the step keys. Any changes to the data also affect the mean conversion loss stored under AVERAGE CNV LOSS. Table 3-3.
Operation Using 8563A, 8561B, 8560A, or 8560 E/EC-Series Spectrum Analyzers automatically peaks the preselector of the external mixer on a desired signal on a trace. Set the trace to clear-write mode, place a marker on the desired point, then press PRESEL AUTO PK. The peaking routine zooms to zero span, peaks the preselector tracking, then returns to the original span. To read the new preselector peaking number, press PRESEL MAN ADJ.
Operation Using 8563A, 8561B, 8560A, or 8560 E/EC-Series Spectrum Analyzers MARKER NORMAL activates a single marker and places it at the center of the trace. This softkey is also annotated as MARKER DELTA, if delta-marker mode has been previously activated by the MARKER DELTA softkey under the MKR menus. If one marker is already on, no operation takes place. If two markers are on (as in MARKER DELTA mode), pressing MARKER DELTA deletes the anchor marker and makes the active one the new, single marker.
Operation Using an E4407B Spectrum Analyzer or 7405A EMC Analyzer Using an E4407B Spectrum Analyzer or 7405A EMC Analyzer Preliminary Operation Compatibility Reference Refer to Chapter 2, “Installation,” on page 27 for information relating to retrofit requirements for E4407B or E7405A analyzer. The E4407B is used in the following procedure. Equipment Connection Connect the equipment as shown in Figure 3-8. and use the following checklist to verify the connections.
Operation Using an E4407B Spectrum Analyzer or 7405A EMC Analyzer Frequency Tracking Calibration This procedure is used to align the frequency of the preselector filter of the Agilent 11974 to the tuned frequency of the analyzer. This procedure should be followed any time that the Agilent 11974 is connected to a different analyzer. The calibration should be periodically checked. 1.
Operation Using an E4407B Spectrum Analyzer or 7405A EMC Analyzer Band Selection 1. If necessary, configure the analyzer for preselected external mixing by pressing the following keys: Input/Output, Input Mixer (Ext), Mixer Config, Mixer Type (Presel) 2. If necessary, adjust the tracking of the Agilent 11974 to the analyzer being used for preselected external mixing, by using the Frequency Tracking Calibration procedure above. 3.
Operation Using an E4407B Spectrum Analyzer or 7405A EMC Analyzer 3. The full Q band display is shown in Figure 3-9. Figure 3-9. 4. To complete the amplitude calibration process, the preselector must be adjusted at each frequency of interest. Before making final amplitude measurements with the analyzer, perform the following: a. Place a marker on the signal of interest. b. Press SPAN, Span Zoom, 10, MHz to zoom in on the signal. c. Press AMPLITUDE, Presel Center.
Operation Using an E4407B Spectrum Analyzer or 7405A EMC Analyzer Manually Entering Conversion-Loss Data 1. Press AMPLITUDE Y Scale, More, Corrections. Select a correction set for use with external mixing. The recommended set to use is Other although any available set could be used. NOTE To correct for the conversion-loss of the harmonic mixer in use, the analyzer amplitude correction feature is used. 2. Press Edit to enter the appropriate conversion loss data for the mixer in use.
Operation Using a PSA Series Spectrum Analyzer Using a PSA Series Spectrum Analyzer Preliminary Operation Compatibility Reference Refer to Chapter 2, “Installation,” on page 27 for information relating to retrofit requirements for E4440A, E4446A, or E4448A analyzer. NOTE Option AYZ is required. The E4443A and E4445A do not support external mixing. Equipment Connection Connect the equipment as shown in Figure 3-11. and use the following checklist to verify the connections.
Operation Using a PSA Series Spectrum Analyzer Frequency Tracking Calibration This procedure is used to align the frequency of the preselector filter of the Agilent 11974 to the tuned frequency of the analyzer. This procedure should be followed any time that the Agilent 11974 is connected to a different analyzer. The calibration should be periodically checked. 1.
Operation Using a PSA Series Spectrum Analyzer 9. Repeat steps 7 and 8 until the green LEDs are lit at both frequencies without additional adjustments. Band Selection 1. If necessary, configure the analyzer for preselected external mixing by pressing the following keys: Input/Output, Input Mixer (Ext), Mixer Config, Mixer Type (Presel) 2.
Operation Using a PSA Series Spectrum Analyzer 3. The full Q band display is shown in Figure 3-12. Figure 3-12. 4. To complete the amplitude calibration process, the preselector must be adjusted at each frequency of interest. Before making final amplitude measurements with the analyzer, perform the following: a. Place a marker on the signal of interest. b. Press SPAN, Span Zoom, 10, MHz to zoom in on the signal. Operation c. Press AMPLITUDE, Presel Center.
Operation Using a PSA Series Spectrum Analyzer Manually Entering Conversion-Loss Data 1. Press AMPLITUDE Y Scale, More, Corrections. Select a correction set for use with external mixing. The recommended set to use is Other although any available set could be used. NOTE To correct for the conversion-loss of the harmonic mixer in use, the analyzer amplitude correction feature is used. 2. Press Edit to enter the appropriate conversion loss data for the mixer in use.
Operation Using 8561A/62A/62B Spectrum Analyzers Using 8561A/62A/62B Spectrum Analyzers Preliminary Operation NOTE For compatibility using an 8561A/62A/62B Spectrum Analyzer as a host to the 11974, the appropriate Option K74 retrofit kit must be installed. Equipment Connections Connect the equipment as shown in Figure 3-14. on page 90 and use the following checklist to verify the connections.
Operation Using 8561A/62A/62B Spectrum Analyzers Frequency Tracking Calibration Use this procedure to align the frequency of the 11974 tracking filter to the tuned frequency of the spectrum analyzer. Follow this procedure anytime that the 11974 is connected to a different spectrum analyzer. Periodically check the calibration. 1.
Operation Using 8561A/62A/62B Spectrum Analyzers 7. Change the spectrum analyzer center frequency to the value indicated below, then save this setting in an unused register: for an 11974A: 40 GHz for an 11974Q: 50 GHz for an 11974U: 60 GHz for an 11974V: 75 GHz 8. On the rear-panel of the 11974, adjust the corresponding potentiometer for the mixer listed below until one or both of the green LEDs are lit.
Operation Using 8561A/62A/62B Spectrum Analyzers Amplitude Calibration Enter the conversion loss table at the preset frequencies from either the calibration label on the bottom of the 11974 or the supplied calibration sheet, by using the following key sequence. (Note: the analyzer automatically interpolates between the preset frequencies.) EXT AMPTD CORRECT CNV LOSS VS FREQ Enter the conversion loss value of the indicated preset frequency, then terminate the entry with dB.
Operation Using 8561A/62A/62B Spectrum Analyzers Sweep Time Considerations For optimum amplitude accuracy, the sweep rate must be less than 40 MHz/ms, according to the table below. Table 3-8. Minimum Sweep Time Frequency Span (GHz) Minimum Sweep Time (ms) 25 625 20 500 17 425 15 375 13.5 338 10 250 5 125 <2 50 Operation General Description of 8561A/62A/62B External-Mixing Functions FULL BAND allows you to select a commonly-used frequency band above 18 GHz.
Operation Using 8561A/62A/62B Spectrum Analyzers Table 3-9. Flatness Points and Conversion Losses for Frequencies above 18 GHz Frequency Band Frequency Range (GHz) Number of Flatness Points Point Spacing Default Conversion Loss K 18.0 to 26.5 6 2 GHz 30 dB A 26.5 to 40.0 8 2 GHz 30 dB Q 33.0 to 50.0 7 3 GHz 30 dB U 40.0 to 60.0 6 4 GHz 30 dB V 50.0 to 75.0 6 5 GHz 30 dB E 60.0 to 90.0 7 5 GHz 30 dB W 75.0 to 110.0 8 5 GHz 30 dB F 90.0 to 140.
Operation Operation Using 8561A/62A/62B Spectrum Analyzers 96 Chapter 3
4 Performance Tests Performance Tests 97
Performance Tests Introduction Introduction This section contains instructions for testing the performance of the 11974 Series Preselected Millimeter Mixers. Performance tests are used to check the mixers at incoming inspection and for periodic evaluation. The tests verify the specifications listed for the 11974 Series in Table 1-1 on page 15.
Performance Tests Test Record Summary Test Record Summary The performance test record summary (Table 4-6 on page 135), which is used for recording and summarizing the performance test data, at the end of this chapter. The test record summary includes the measurement uncertainty for each band, calculated as the root sum square of the error terms. A test record summary has been provided for each band, therefore use the appropriate pages in Table 4-6 for your band.
Performance Tests Performance Test Procedures Performance Test Procedures Each performance test is contained in a single paragraph. All specifications for the parameters being measured are described in Table 1-1 on page 15. This is followed by a general description of the test and any special instructions or problem areas. Appropriate test setup illustrations are included in this section and are referenced in the test procedures.
Performance Tests Performance Test Procedures Table 4-1 Recommended Test Equipment for 11974A Instrument Critical Specifications Recommended Model Spectrum Analyzer LO and IF ranges compatible with 11974A 8566B SWEEP + TUNE voltage compatible with 11974A. w/serial prefix 2948 or later Frequency: 13.
Performance Tests Performance Test Procedures Table 4-2 Recommended Test Equipment for 11974Q Instrument Critical Specifications Recommended Model Spectrum Analyzer LO and IF ranges compatible with 11974Q 8566B SWEEP + TUNE voltage compatible with 11974Q.
Performance Tests Performance Test Procedures Table 4-3 Recommended Test Equipment for 11974U Instrument Critical Specifications Recommended Model Spectrum Analyzer LO and IF ranges compatible with 11974U 8566B SWEEP + TUNE voltage compatible with 11974U.
Performance Tests Performance Test Procedures Table 4-4 Recommended Test Equipment for 11974V Instrument Critical Specifications Recommended Model Spectrum Analyzer LO and IF ranges compatible with 11974V 8566B SWEEP + TUNE voltage compatible with 11974V. w/serial prefix 2948 or later Frequency: 12.
Performance Tests Performance Test Procedures Table 4-5 Recommended Accessories for All Bands Accessory Critical Specifications Recommended Model Adapter (1 required) SMA (f) to Type N (f) 1250-1772 Adapter (1 required) Type N (m) to APC 3.5 (f) 1250-1744 Cables (3 required) Connectors: SMA (m) 5061-5458 Cable (1 required) Connectors: APC 3.
Performance Tests Performance Test Procedures Performance Tests Figure 4-1 Performance Tests Setup 106 Chapter 4
Performance Tests Frequency Tracking Calibration with an 8566B Spectrum Analyzer Frequency Tracking Calibration with an 8566B Spectrum Analyzer In order for the 8566B to be compatible with the 11974 Series Preselected Millimeter Mixer, it must have a serial prefix of 2948 or later. If not, retrofit kit 8566B K74 must be installed before using an 8566B for the testing of the 11974. NOTE 1.
Performance Tests Frequency Tracking Calibration with an 8566B Spectrum Analyzer 7. Set the spectrum analyzer center frequency to the low end of the band by pressing CENTER FREQUENCY and entering the corresponding value for the mixer listed below. Save this setting in an unused register. for an 11974A: 26.5 GHz for an 11974Q: 33.0 GHz for an 11974U: 40.0 GHz for an 11974V: 50.0 GHz 8.
Performance Tests 1. Conversion Loss 1. Conversion Loss Description The conversion loss is checked at a nominal local-oscillator power level. A known input power is applied to the input of the 11974. The IF output power is measured on an 8566B Spectrum Analyzer. From the measurements, the conversion loss is calculated. The calibration factors versus frequency of the millimeter-wave power-meter sensor and the coupling factors versus frequency of the coupler are needed in this measurement. Procedure 1.
Performance Tests 1. Conversion Loss CAUTION Turn off the ac power on the 8349B Amplifier prior to connecting or disconnecting the source module interface cable. Turn off the ac power on the 11974-60028 Preselector Power Supply when either connecting or disconnecting the 11974 from it. On the 11974 rear panel, set the instrument select switches to the appropriate settings before applying power to the 11974. 8. Turn off the RF power on the synthesized sweeper and zero the 432A Power Meter. 9.
Performance Tests 1. Conversion Loss 15.Set the spectrum analyzer controls as follows: SHIFT, 5, MHz, 0, and dB (sets external mixer conversion loss to 0 dB) FREQUENCY SPAN . . . . . . . . . . . . . . . . . . . . . . . . . . . . . . . . . . . . . . . . . 5 MHz ENTER dB/DIV . . . . . . . . . . . . . . . . . . . . . . . . . . . . . . . . . . . . . . . . . . . . . . . 5 dB CF STEP SIZE . . . . . . . . . . . . . . . . . . . . . . . . . . . . . . . . . . . . . . . . . . . . 500 MHz 16.
Performance Tests 1. Conversion Loss 20.Calculate the conversion loss (CL) of the 11974 with the equations given below. If the power meter calibration factor is given in % or decimal form, for example, 93% or 0.93, then: CL = Power Meter Reading − 10 × log (Cal Factor) − SA Marker Amplitude − Coupling Factor If the power meter correction factor is given in dB, then: CL = Pwr Mtr Reading + Pwr Mtr Correction Factor − SA Marker Amplitude − Coupling Factor For Example: Power Meter Reading = −0.
Performance Tests 1. Conversion Loss 24.On the spectrum analyzer, press MARKER PEAK SEARCH and PRESEL PEAK. 25.Repeat step 19 through step 24 until data has been recorded for the appropriate maximum frequency listed below: for an 11974A: 40 GHz for an 11974Q: 50 GHz for an 11974U: 60 GHz for an 11974V: 75 GHz 26.Record the Maximum Conversion Loss in Table 4-7 on page 140.
Performance Tests 2. Image Rejection Test 2. Image Rejection Test Description The image rejection is checked at an LO power level of +15.2 dBm. A known input power is applied to the input of the mixer. The IF output power is measured on an 8566B Spectrum Analyzer at the input signal frequency and at the image response frequency. From the measurements, the image rejection is determined.
Performance Tests 2. Image Rejection Test CAUTION Turn off the ac power on the 8349B prior to connecting or disconnecting the source module interface cable. Turn off the ac power on the 11974-60028 Preselector Power Supply prior to connecting or disconnecting the 11974. On the 11974 rear panel, set the instrument select switches to the appropriate settings before applying power to it. 7.
Performance Tests 2. Image Rejection Test 14.Set the spectrum analyzer reference level by pressing REFERENCE LEVEL and entering the corresponding value for the band listed below: for an 11974A: −40 dBm for an 11974Q: −40 dBm for an 11974U: −40 dBm for an 11974V: −55 dBm 15.Set the spectrum analyzer center frequency by pressing CENTER FREQUENCY and entering the corresponding value for the band listed below: for an 11974A: 26.5 GHz for an 11974Q: 33 GHz for an 11974U: 40 GHz for an 11974V: 50 GHz 16.
Performance Tests 2. Image Rejection Test 24.Repeat step 16 through step 23 until data has been recorded for the appropriate maximum frequency listed below: for an 11974A: 40 GHz for an 11974Q: 50 GHz for an 11974U: 60 GHz for an 11974V: 75 GHz 25.Record the Minimum Image Rejection value in Table 4-8 on page 143. NOTE For the 11974V, record the Minimum Image Rejection in each portion of the band.
Performance Tests 3. Multiple Response Rejection Test 3. Multiple Response Rejection Test Description The multiple response rejection is checked at an LO power level of +15.2 dBm. A known input power is applied to the input of the mixer. The IF output power is measured on an 8566B Spectrum Analyzer at the input signal frequency and at the multiple response frequencies. From the measurements, the multiple response rejection is determined.
Performance Tests 3. Multiple Response Rejection Test CAUTION When you are using an 11975A Amplifier with an 11974, you must set the amplifier rear-panel ALC switch to ON before you connect the amplifier to the test setup. If the ALC switch is left in the OFF position, the amplifier output power is high enough to destroy the mixer diodes. 4.
Performance Tests 3. Multiple Response Rejection Test 11.Set the spectrum analyzer to the appropriate millimeter band by using the following key sequence: for an 11974A: SHIFT ⇑ ⇑ for an 11974Q: SHIFT ⇑ ⇑ ⇑ for an 11974U: SHIFT ⇑ ⇑ ⇑ ⇑ for an 11974V: SHIFT ⇑ ⇑ ⇑ ⇑ ⇑ 12.Set the spectrum analyzer controls as follows: SHIFT, 5, MHz, 0, and dB (sets external mixer conversion loss to 0 dB) FREQUENCY SPAN . . . . . . . . . . . . . . . . . . . . . . . . . . . . . . . . . . . . . . . . 50 kHz ENTER dB/DIV . . . .
Performance Tests 3. Multiple Response Rejection Test 19.On the spectrum analyzer, press CENTER FREQUENCY and tune to a multiple response by entering the frequency value for the corresponding band listed below: for an 11974A: 35.226200 GHz (n′ = 6+) for an 11974Q: 41.169650 GHz (n′ = 8+) for an 11974U: 49.919650 GHz (n′ = 8+) for an 11974V: 58.279767 GHz (n′ = 12+) 20.Record the above frequency in Table 4-9 on page 144 as Multiple Response Frequency #1.
Performance Tests 3. Multiple Response Rejection Test 26.On the spectrum analyzer, press CENTER FREQUENCY and tune to the frequency listed below for the corresponding band: for an 11974A: 33.25 GHz for an 11974Q: 41.50 GHz for an 11974U: 50.00 GHz for an 11974V: 62.50 GHz 27.On the spectrum analyzer, press the following keys: MARKER NORMAL PEAK SEARCH PRESEL PEAK 28.When the preselector-peak routine is complete, press PEAK SEARCH. 29.
Performance Tests 3. Multiple Response Rejection Test 36.Record the multiple response rejection in Table 4-9 on page 144 as Multiple Response Rejection #4. 37.On the spectrum analyzer, press CENTER FREQUENCY and tune to the next multiple response by entering the frequency value for the corresponding band listed below: for an 11974A: Response not in band. Skip to step 40. for an 11974Q: Response not in band. Skip to step 40. for an 11974U: Response not in band. Skip to step 40. for an 11974V: 72.
Performance Tests 3. Multiple Response Rejection Test 44.On the spectrum analyzer, press CENTER FREQUENCY and tune to the frequency for the corresponding band listed below: for an 11974A: 40.00 GHz for an 11974Q: 50.00 GHz for an 11974U: 60.00 GHz for an 11974V: 75.00 GHz 45.On the spectrum analyzer, press the following keys: MARKER NORMAL PEAK SEARCH PRESEL PEAK 46.When the preselector-peak routine is complete, press PEAK SEARCH. 47.
Performance Tests 3. Multiple Response Rejection Test 54.Record the multiple response rejection in Table 4-9 on page 144 as Multiple Response Rejection #8. 55.Record the Minimum Multiple Response Rejection in Table 4-9 on page 144. NOTE For the 11974V, record the Minimum Multiple Response Rejection for signal frequencies in each portion of the band.
Performance Tests 4. Displayed Average Noise Level 4. Displayed Average Noise Level Description The displayed average noise level is checked at three frequencies with an LO power level of +15.2 dBm. The RF source is turned off and, at each frequency, the conversion loss measured in the Conversion Loss Test is entered into the spectrum analyzer. The spectrum analyzer is put in zero span and the average noise level is measured.
Performance Tests 4. Displayed Average Noise Level CAUTION Turn off the ac power on the 11974-60028 Preselector Power Supply prior to connecting or disconnecting it from the 11974. On the 11974 rear panel, set the instrument select switches to the appropriate settings before applying power to the 11974. 7.
Performance Tests 4. Displayed Average Noise Level 14.Record the following in Table 4-10 on page 146. Center Frequency Displayed Average Noise Level (Marker Amplitude) 15.On the spectrum analyzer, press SHIFT and SWEEP TIME to turn off the video average function. 16.On the spectrum analyzer, press CENTER FREQUENCY and enter the corresponding value for the band listed below: for an 11974A: 40 GHz for an 11974Q: 50 GHz for an 11974U: 60 GHz for an 11974V: 75 GHz 17.
Performance Tests 4. Displayed Average Noise Level 27.On the spectrum analyzer, press SHIFT and SWEEP TIME to turn off the video average function. 28.Record the Maximum Displayed Average Noise Level in Table 4-10 on page 146.
Performance Tests 5. 3 dB Bandwidth 5. 3 dB Bandwidth Description The preselector peak digital-to-analog converter (DAC) is used to tune the center frequency of the preselector filter until the input signal is 3 dB down on the skirts of the filter. The 3 dB bandwidth is calculated from the DAC values. Procedure 1. Connect an SMA cable from the 1ST LO OUTPUT of the spectrum analyzer to the INPUT of the 11975A Amplifier. Connect a second SMA cable to the OUTPUT of the amplifier. 2.
Performance Tests 5. 3 dB Bandwidth 7. Enter the appropriate millimeter-wave source module frequency multiplication factor into the synthesized sweeper by pressing SHIFT and START FREQ. Press the following keys (on the synthesized sweeper) for the appropriate band: for an 11974A: 2 Hz for an 11974Q: 3 Hz for an 11974U: 3 Hz for an 11974V: 4 Hz 8. Set the synthesized sweeper for a CW signal at the frequency listed below: for an 11974A: 26.5 GHz for an 11974Q: 33.0 GHz for an 11974U: 40.
Performance Tests 5. 3 dB Bandwidth 14.Set the center frequency of the spectrum analyzer by pressing CENTER FREQUENCY and entering the corresponding value for the band listed below: for an 11974A: 26.5 GHz for an 11974Q: 33 GHz for an 11974U: 40 GHz for an 11974V: 50 GHz 15.On the spectrum analyzer, press the following keys: MARKER NORMAL PEAK SEARCH PRESEL PEAK 16.When the preselector-peak routine is complete, press MARKER PEAK SEARCH and ∆. 17.
Performance Tests 5. 3 dB Bandwidth 22.Calculate the 3 dB bandwidth at this frequency using the following equation: High DAC number – Low DAC number – 1--------------------------------------------------------------------------------------------------------× 46 × n ( MHz ) 63 where n represents the harmonic number listed below: 11974A: 8 11974Q: 10 11974U: 10 11974V: 14 NOTE The above equation applies only when the spectrum analyzer is an 8566B.
Performance Tests 5. 3 dB Bandwidth 27.Set the center frequency of the spectrum analyzer by pressing CENTER FREQUENCY, then entering the corresponding value for the band listed below: for an 11974A: 40 GHz for an 11974Q: 50 GHz for an 11974U: 60 GHz for an 11974V: 75 GHz 28.Repeat step 15 through step 22 for this center frequency and record the results in Table 4-11 on page 146. Performance Tests 29.Record the Minimum 3 dB Bandwidth in Table 4-11 on page 146.
Performance Tests 5. 3 dB Bandwidth Table 4-6 Performance Test Record Summary (1 of 2) for 11974A, Q, U, and V Calibration Entity: __________________________________________ Report No. ________________________________ __________________________________________ __________________________________________ Date _____________________________________ __________________________________________ (e.g. 10 SEP 1989) Model Number ____________________________ Serial No.
Performance Tests 5. 3 dB Bandwidth Table 4-6 Performance Test Record Summary (2 of 2) for 11974A Model 11974A Serial No. Report No. ________________________________ ________________________________ Date ______________________________________ Test No. 1. Results Test Description Min. Uncertainty __________ 44 dB ±1.5 dB Image Rejection Test 25. Minimum Image Rejection 3. Max. Conversion Loss 26. Maximum Conversion Loss 2. Measured Measurement 59 dBa __________ ±1.
Performance Tests 5. 3 dB Bandwidth Table 4-6 Performance Test Record Summary (2 of 2) for 11974Q Model 11974Q Report No. ________________________________ Serial No. ________________________________ Date _____________________________________ Test Results No. 1. Test Description Min. Measured Measurement Max. Uncertainty Conversion Loss 26. Maximum Conversion _________ 46 dB ±1.5 dB Loss 2. Image Rejection Test 25. Minimum Image Rejection 3. 55 dBa _________ ±1.
Performance Tests 5. 3 dB Bandwidth Table 4-6 Performance Test Record Summary (2 of 2) for 11974U Model 11974U Report No. ________________________________ Serial No. _________________________________ Date ______________________________________ Test Results No. 1. Test Description Min. Measured Measurement Max. Uncertainty Conversion Loss 26. Maximum Conversion _________ 43 dB ±1.6 dB Loss 2. Image Rejection Test 25. Minimum Image Rejection 3. 55 dBa _________ ±1.
Performance Tests 5. 3 dB Bandwidth Table 4-6 Performance Test Record Summary (2 of 2) for 11974V Model 11974V Report No. ________________________________ Serial No. ________________________________ Date _____________________________________ Test Results No. 1. Test Description Min. Measured Measurement Max. Uncertainty Conversion Loss 26. Maximum Conversion _________ 46 dB ±1.5 dB Loss 2. Image Rejection Test 25. Minimum Image Rejection 3. (50 to 67 GHz) 55 dBa _________ ±1.
Performance Tests 5. 3 dB Bandwidth Table 4-7 Conversion Loss Test Data (1 of 3) Performance Tests Model ____________________________ Report No. ________________________________ Serial No.
Performance Tests 5. 3 dB Bandwidth Table 4-7 Conversion Loss Test Data (2 of 3) Model ___________________________ Report No. ________________________________ Serial No.
Performance Tests 5. 3 dB Bandwidth Table 4-7 Conversion Loss Test Data (3 of 3) Performance Tests Model ____________________________ Report No. ________________________________ Serial No.
Performance Tests 5. 3 dB Bandwidth Marker Frequency GHz Marker Amplitude dBm Power Meter Readings dBm Power Sensor Cal Factor % or dB Directional Coupler Coupling Factor dB Conversion Loss dB Table 4-8 Image Rejection Test Data Model ___________________________ Report No. ________________________________ Serial No.
Performance Tests 5. 3 dB Bandwidth Image Rejection dB Marker Frequency GHz Marker Frequency GHz Image Rejection dB Image Rejection dB Marker Frequency GHz Minimum Image Rejection = ________________ dB 11974V (67–75 GHz): Minimum Image Rejection = ________________dB Table 4-9 Multiple Response Rejection Test Data Model ____________________________ Report No. ________________________________ Serial No.
Performance Tests 5.
Performance Tests 5. 3 dB Bandwidth Model ____________________________ Report No. ________________________________ Serial No.
Safety and Regulatory Information 5 Safety and Regulatory Information 147
Safety and Regulatory Information Safety and Regulatory Information Safety Symbols Safety Symbols The following safety notes are used throughout this manual. Familiarize yourself with each of the notes and it’s meaning before operating this instrument. WARNING Warning denotes a hazard. It calls attention to a procedure which, if not correctly performed or adhered to, could result in injury or loss of life. Do not proceed beyond a warning note until the indicated conditions are fully understood and met.
General Safety Considerations WARNING Before this instrument is switched on, make sure it has been properly grounded through the protective conductor of the ac power cable to a socket outlet provided with protective earth contact. Any interruption of the protective (grounding) conductor, inside or outside the instrument, or disconnection of the protective earth terminal can result in personal injury.
Safety and Regulatory Information Safety and Regulatory Information General Safety Considerations WARNING If this product is not used as specified, the protection provided by the equipment could be impaired. This product must be used in a normal condition (in which all means for protection are intact) only. WARNING This is a Safety Class I product (provided with a protective earthing ground incorporated in the power cord).
CAUTION This product is designed for use in Installation Category II and Pollution Degree 2 per IEC-1010 and IEC-664 respectively. CAUTION Before this instrument is switched on, make sure its primary power circuitry has been adapted to the voltage of the ac power source. Failure to set the ac power input to the correct voltage could cause damage to the instrument when the ac power cable is plugged in. CAUTION Always use the three-prong AC power cord supplied with this product.
Safety and Regulatory Information Safety and Regulatory Information Declaration of Conformity Declaration of Conformity 152 Chapter 5
Index Numerics 11974 accessories, 11 front-panel features, 50, 52 power requirements, 33 rear-panel features, 51 remote location, 55 serial numbers, 12 11974 Overview, 10 8561A/62A/62B sweep time considerations, 94 B band selection using a 71000C, 66, 74 using an 8561A/62A/62B, 92 C calibration, 13 characteristic tables, 19 characteristics, 14 checking the fuse, 34 CNV LOSS VS FREQ softkey, 77, 94 compatibility, 29 CONV LOSS softkey, 68 conversion loss, 68, 76, 77, 94, 95 frequency bands, 77, 95 conversio
Index Index foam inserts, 42 repackaging, 42 repair tags, 42 return to factory, 42 specification tables, 14 specifications, 14 spectrum analyzer compatibility, 29 spurious response tests, 54 static-safe workstation, 39 T tracking frequency, 81 U unpreselected external mixing, 76, 94 154 Index