Agilent InfiniiVision 6000 Series Oscilloscopes User’s Guide Agilent Technologies
Notices © Agilent Technologies, Inc. 2005-2008 Warranty No part of this manual may be reproduced in any form or by any means (including electronic storage and retrieval or translation into a foreign language) without prior agreement and written consent from Agilent Technologies, Inc. as governed by United States and international copyright laws. The material contained in this document is provided “as is,” and is subject to being changed, without notice, in future editions.
In This User’s Guide… This guide shows you how to use the Agilent InfiniiVision 6000 Series oscilloscopes. It contains the following chapters and topics: 1 Getting Started Unpacking and setting up your oscilloscope, using Quick Help. 2 Front-Panel Controls A quick overview of the front-panel controls. 3 Viewing and Measuring Digital Signals How to connect and use the digital channels of a mixed-signal oscilloscope (MSO).
The Agilent InfiniiVision 6000 Series oscilloscopes deliver powerful features and high performance: • 100 MHz, 300 MHz, 500 MHz, and 1 GHz bandwidth models. • Up to 4 GSa/s sample rate. • Powerful triggering including analog HDTV, I2C, SPI, LIN, CAN, and USB. • USB, LAN, and GPIB ports make printing, saving and sharing data easy. • 2-channel and 4-channel Digital Storage Oscilloscope (DSO) models. • 2+16-channel and 4+16-channel Mixed Signal Oscilloscope (MSO) models.
Table 1 Model Numbers, Bandwidths, and Sampling Rates Bandwidth 100 MHz 300 MHz 500 MHz 1 GHz Maximum Sample Rate 2 GSa/s 2 GSa/s 4 GSa/s 4 GSa/s 2-Channel + 16 Logic Channels MSO MSO6012A MSO6032A MSO6052A MSO6102A 4-Channel + 16 Logic Channels MSO MSO6014A MSO6034A MSO6054A MSO6104A 2-Channel DSO DSO6012A DSO6032A DSO6052A 4-Channel DSO DSO6014A, DSO6014L DSO6034A DSO6054A, DSO6104A, DSO6054L DSO6104L Table 2 DSO6102A Secure Environment Mode Option Oscilloscope History Action
Memory upgrades can be easily installed without returning the oscilloscope to a Service Center. These upgrades are licensed.
The following option cannot be installed after time of purchase. Table 5 Order-Only Options Licensed Option Order Battery Operation (Option BAT) Available at time of purchase. Option can not be added after purchase. Visit www.agilent.com/find/mso6000 to view the 6000A Series and 6000L Series data sheets.
Built-in Quick Help A Quick Help system is built into the oscilloscope. Instructions for using the quick help system are given on page 58. Digital Channels Because all of the oscilloscopes in the Agilent 6000 Series have analog channels, the analog channel topics in this book apply to all instruments. Whenever a topic discusses the digital channels, that information applies only to Mixed-Signal Oscilloscope (MSO) models or DSO models that have been upgraded to an MSO.
Contents 1 Getting Started 19 To inspect package contents 22 To adjust the 6000A Series handle 28 To mount the oscilloscope in a rack 29 To mount the 6000A Series oscilloscope in a rack To mount the 6000L Series oscilloscope in a rack Ventilation requirements 29 29 32 To power-on the oscilloscope 33 AC-Powered 6000 Series 33 Battery-Powered 6000A Series 33 Maintain oscilloscope ground connection 34 The remote interface 38 To establish a LAN connection (6000A Series) 39 To establish a LAN connectio
Contents Maximum input voltage for analog inputs 52 To verify basic oscilloscope operation To compensate the oscilloscope probes To calibrate the probes 52 54 55 Passive Probes Supported 55 Active Probes Supported 56 By 300 MHz, 500 MHz, and 1 GHz Bandwidth Models By 100 MHz Bandwidth Models 57 Using Quick Help 58 Quick Help Languages 2 Front-Panel Controls 56 59 61 6000L Series Oscilloscope Controls 62 Front and Rear Panel Controls and Connectors 63 6000A Series Oscilloscope Front-Panel Contro
Contents 6000A Series Front-Panel Operation 76 To adjust the waveform intensity 76 To adjust the display grid (graticule) intensity 76 To start and stop an acquisition 77 To make a single acquisition 78 To pan and zoom 79 Choosing Auto trigger mode or Normal trigger mode 80 Using AutoScale 80 To set the probe attenuation factor 81 Using the analog channels 83 To set up the Horizontal time base 88 To make cursor measurements 95 To make automatic measurements 96 Using Labels 97 To print the display 101 To se
Contents Interpreting the digital waveform display 118 To switch all digital channels on or off 119 To switch groups of channels on or off 119 To switch a single channel on or off 119 To change the displayed size of the digital channels To reposition a digital channel 120 To change the logic threshold for digital channels To display digital channels as a bus 4 Triggering the Oscilloscope 120 121 122 127 Selecting Trigger Modes and Conditions 130 To select the Mode and Coupling menu 130 Trig
Contents To use Pulse Width triggering < qualifier time set softkey > qualifier time set softkey 142 144 144 To use Pattern triggering 145 Hex Bus Pattern Triggering 147 To use CAN triggering 148 To use Duration triggering 152 < qualifier time set softkey 154 > qualifier time set softkey 154 To use FlexRay triggering 155 Modes of VPT1000 Control/Operation 155 Setting Up the Oscilloscope and the VPT1000 156 Triggering on FlexRay Frames, Times, or Errors 160 To use I2C triggering 164 To use Nth Edge Bu
Contents To use TV triggering 187 Example exercises 191 To trigger on a specific line of video 191 To trigger on all sync pulses 193 To trigger on a specific field of the video signal 194 To trigger on all fields of the video signal 195 To trigger on odd or even fields 196 To use UART/RS232 triggering To use USB triggering 199 204 The Trigger Out connector 206 Triggers 206 Source frequency 206 Source frequency/8 206 5 Making Measurements 207 To use the XY horizontal mode 208 Math Functions 213 Math
Contents Automatic Measurements 239 To make an automatic measurement 240 To set measurement thresholds 241 Time Measurements 243 Delay and Phase Measurements 247 Voltage Measurements 249 Overshoot and Preshoot Measurements 255 6 Displaying Data 257 Pan and Zoom 258 To pan and zoom a waveform 259 To set the waveform expansion reference point Antialiasing 259 260 Using the XGA video output Display Settings 261 Infinite persistence 261 Grid intensity 262 Vectors (connect the dots) 260 262 Varying the
Contents Using Serial Decode 271 To decode I2C data 272 To decode SPI data 276 To decode CAN data 281 CAN Totalizer 286 To decode LIN data 288 To decode FlexRay data 294 FlexRay Totalizer 298 To decode UART/RS232 data 300 UART/RS232 Totalizer 306 To reduce the random noise on a signal HF Reject 307 LF Reject 308 Noise rejection 308 307 To capture glitches or narrow pulses with peak detect and infinite persistence 309 Using peak detect mode to find a glitch 310 How AutoScale Works 312 Undo AutoScale 312 S
Contents Saving oscilloscope data 320 Selecting a destination for your saved data 321 Selecting a file name 322 Waveform Trace and Oscilloscope Setup 324 Display Image and Waveform Data Files 324 Choosing save settings 325 To save a waveform and/or setup to a USB device 327 To save a waveform and/or setup to the oscilloscope’s internal memory 327 To recall waveform trace and/or oscilloscope setup 328 File explorer 328 To use the file explorer 330 Secure Environment Mode Option 8 Reference 331 333 Upgrad
Contents Digital channel signal fidelity: Probe impedance and grounding 340 Input Impedance 340 Probe Grounding 342 Best Probing Practices 344 To replace digital probe leads 345 Binary Data (.
Agilent 6000 Series Oscilloscope User’s Guide 1 Getting Started To inspect package contents 22 To adjust the 6000A Series handle 28 To mount the oscilloscope in a rack 29 To power-on the oscilloscope 33 Ventilation requirements 32 The remote interface 38 To establish a LAN connection (6000A Series) 39 To establish a LAN connection (6000L Series) 40 To establish a point-to-point LAN connection 42 To use the Web interface 43 Printing the oscilloscope’s display from a web browser 50 To connect the oscilloscop
1 Getting Started ✔ Verify basic oscilloscope operation and compensate the probes.
Getting Started 1 Built-in Quick Help A Quick Help system is built into the oscilloscope. Instructions for using the quick help system are given on page 58. Digital Channels Because all of the oscilloscopes in the Agilent 6000 Series have analog channels, the analog channel topics in this book apply to all instruments. Whenever a topic discusses the digital channels, that information applies only to Mixed-Signal Oscilloscope (MSO) models or DSO models that have been upgraded to an MSO.
1 Getting Started To inspect package contents ✔ Inspect the shipping container for damage. If your shipping container appears to be damaged, keep the shipping container or cushioning material until you have inspected the contents of the shipment for completeness and have checked the oscilloscope mechanically and electrically.
Getting Started Front-panel cover 1 6000A Series Oscilloscope Manuals and CD-ROMs Oscilloscope probes 10073C or 10074C (Qty 2 or 4) Digital Probe Kit* (MSO models only) Power cord (Part numbers given on page 37) *Digital Probe Kit contains: 54620-61801 16-channel cable (qty 1) 5959-9334 2-inch probe ground leads (qty 5) 5090-4833 Grabber (qty 20) Digital probe replacement parts are listed on page 345 Figure 1 Digital cable guide (MSO models only) Package contents for 6000A Series AC-powered oscill
1 Getting Started Front-panel cover 6000A Series Option BAT Oscilloscope Oscilloscope probes 10073C or 10074C (Qty 2 or 4) Ground wire Digital Probe Kit* (MSO models only) AC/DC power adapter Power cord (see Power Cords table) Manuals and CD-ROMs Digital cable guide (MSO models only) *Digital Probe Kit contains: 54620-61801 16-channel cable (qty 1) 5959-9334 2-inch probe ground leads (qty 5) 5090-4833 Grabber (qty 20) Digital probe replacement parts are listed in the Reference chapter.
Getting Started 1 6000L Series Oscilloscope 50 ohm feedthrough termination adapter P/N 0960-0301, Qty. 4 GPIB cable extender P/N 5183-0803 Oscilloscope Probes 10073C or 10074C Qty.
1 Getting Started Table 6 Accessories available Model N2918A 1180CZ N2919A N2916A 54684-44101 N2605A-097 10833A 10073C 10074C 54620-68701 54684-42301 0960-0301 01650-61607 54620-68701 10070C 10074C 10073C 1165A 10076A N2771A 1156A 1144A 1145A† 1130A† N2772A 1141A 1146A 1147A† N2780A N2781A 26 Description 6000 Series Oscilloscope Evaluation Kit Testmobile oscilloscope cart (requires N2919A adapter kit) Testmobile Adapter Kit 6000A Rackmount Kit Front-panel cover USB cable GPIB cable, 1 m long Passive
Getting Started Model N2782A N2783A 10072A 10075A 10076A E2613B E2614A E2615B E2616A E2643A E2644A 1 Description Current probe, 50 MHz, 30 A, AC/DC (use with N2779A power supply) Current probe, 100 MHz, 30 A, AC/DC (use with N2779A power supply) Fine-pitch probe kit 0.5 mm IC clip kit 100:1, 4 kV 250 MHz probe 0.5 mm Wedge probe adapter, 3-signal, qty 2 0.5 mm Wedge probe adapter, 8-signal, qty 1 0.65 mm Wedge probe adapter, 3-signal, qty 2 0.65 mm Wedge probe adapter, 8-signal, qty 1 0.
1 Getting Started To adjust the 6000A Series handle You can use the oscilloscope’s handle for carrying the instrument, or you can use it as a stand to tilt the instrument up for easier viewing of its display. 1 Grasp the handle hubs on each side of the instrument and pull the hubs out until they stop. 2 Without releasing the hubs, rotate the handle to the desired position. Then release the hubs. Continue rotating the handle until it clicks into a set position.
Getting Started 1 To mount the oscilloscope in a rack The InfiniiVision 6000 Series oscilloscopes can be mounted into Electronic Industries Association (EIA) standard 19-inch (487-mm) rack cabinets. To mount the 6000A Series oscilloscope in a rack Purchase and install the N2916A rack mount kit. Instructions are included in the kit. To mount the 6000L Series oscilloscope in a rack The 6000L Series oscilloscope is supplied with all necessary hardware for installation into a standard EIA 19-inch rack.
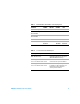
1 Getting Started Step 4 If needed Step 1, step 5 Step 2 Step 3 If needed 1 Loosely attach the Front Extender Supports to the Rear Extender Supports with four (4) clip-nuts and four (4) of the 10-32 x 0.375 Rail Screws. (The screws require a Torx T20 driver.) Choose the correct set of slots in the supports such that their overall length is approximately correct for the depth of your cabinet.
Getting Started 1 2 Fasten the Rack Mount Extenders to the oscilloscope chassis with the four (4) M3 x 6 mm screws, using a Torx T10 driver as follows: NOTE The sets of holes in the Rack Mount Extenders are slightly offset. This was done to ensure that the Rack Mount Extenders are attached to the oscilloscope at the correct points so that the oscilloscope’s ventilation area is not obscured.
1 Getting Started Extenders to the rack using the four (4) remaining 10-32 x 0.375 Rail Screws. Use the Torx T20 driver. 5 Securely attach the Rear Extender Supports to the Front Extender Supports by tightening the four (4) 10-32 x 0.375 Rail Screws screws that you loosely attached in step 1. Ventilation requirements The air intake and exhaust areas must be free from obstructions. Unrestricted air flow is required for proper cooling.
Getting Started 1 To power-on the oscilloscope AC-Powered 6000 Series 1 Connect the power cord to the rear of the oscilloscope, then to a suitable AC voltage source. The oscilloscope automatically adjusts for input line voltages in the range 100 to 240 VAC. Ensure that you have the correct line cord. See Table 8 on page 37. The line cord provided is matched to the country of origin. WA R N I N G Always use a grounded power cord. Do not defeat the power cord ground. 2 Press the power switch.
1 Getting Started The 6000A Series Option BAT oscilloscopes are battery powered. They have additional LED indicators on the front panel: Caution indicator. Lights (amber) when running on the internal battery. See “Operating with the Internal Battery” below. Battery power indicator. Turns from green to red when there is 15 to 20 minutes of battery power remaining. Charging indicator. Lights when the battery is charging. Turns off when the battery is fully charged or when the charger is disconnected.
Getting Started 1 Ground Post Figure 5 Ground post on rear panel 3 Press the power switch. The power switch is located on the lower left corner of the front panel. Some front panel lights will come on and the oscilloscope will be operational in a few seconds.
1 Getting Started Charging the Battery When charging the battery, the operating temperature should be in the range from 0°C to 45°C, ≤ 80% relative humidity. 1 Connect the supplied AC adapter to the back of the oscilloscope, and connect the adapter’s power cord to a suitable AC voltage source. CAUTION Use only the supplied AC adapter. Damage to the equipment could result if an improper AC adapter is used. You can use the oscilloscope while the battery is being charged.
Getting Started Table 8 Power Cords Plug Type Cable Part Number Plug Type Cable Part Number Opt 900 (U.K.) 8121-1579 Opt 918 (Japan) 8121-1603 Opt 901 (Australia) 8121-1581 Opt 919 (Israel) 8121-1662 Opt 902 (Europe) 8121-1580 Opt 920 (Argentina) 8121-1599 Opt 903 (U.S.A.
1 Getting Started The remote interface You can communicate with all InfiniiVision 6000 Series oscilloscopes via LAN, USB, or GPIB. 6000A Series oscilloscopes can also be controlled using the front panel keys. The 6000L Series oscilloscopes do not have a keyboard or display, so communication must be established via LAN, USB, or GPIB. The Automation Ready CD-ROM provided with the oscilloscope contains connectivity software to enable communication over these interfaces.
Getting Started 1 To establish a LAN connection (6000A Series) 1 If the controller PC isn’t already connected to the local area network (LAN), do that first. 2 Get the oscilloscope’s network parameters (hostname, domain, IP address, subnet mask, gateway IP, DNS IP, etc.) from your network administrator. 3 Connect the oscilloscope to the local area network (LAN) by inserting the LAN cable into the “LAN” port on the rear panel of the oscilloscope.
1 Getting Started To establish a LAN connection (6000L Series) 1 Connect a cable from your site Local Area Network (LAN) to the LAN port on the rear panel of the oscilloscope. 2 Switch on the oscilloscope power. When the LAN indicator illuminates green, the LAN is connected as configured. This may take a few minutes. The oscilloscope will attempt to connect to the LAN using DHCP, AutoIP, then Manual, in that order (when enabled).
Getting Started NOTE 1 Any time you modify the oscilloscope’s hostname it will break the connection between the oscilloscope and the LAN. You will need to re-establish communication to the oscilloscope using the new hostname. For more information about connecting to the oscilloscope, refer to the Agilent Technologies USB/LAN/GPIB Interfaces Connectivity Guide. For a printable electronic copy of the Connectivity Guide, direct your Web browser to www.agilent.com and search for Connectivity Guide.
1 Getting Started To establish a point-to-point LAN connection Stand-alone connection to a PC The following procedure describes how to establish a point-to-point (stand alone) connection to the oscilloscope. This is useful if you want to control the oscilloscope using a laptop computer or a stand-alone computer. 1 Install Agilent I/O Libraries Suite from the CD that was supplied with the oscilloscope. If you do not have the CD you can download the I/O Libraries Suite from www.agilent.com/find/iolib.
Getting Started 1 11 When the instrument is found, select OK and OK to close the Add Instrument windows. Now the instrument is connected and the instrument’s Web interface may be used. To use the Web interface All InfiniiVision 6000 Series oscilloscopes include a built-in Web server (requires software version 4.0 and above). See page 334 for information about updating your oscilloscope’s software.
1 Getting Started Controlling the oscilloscope using a Web browser A built-in Web server allows communication and control via a Java™-enabled Web browser. Measurements can be set up, waveforms can be monitored, screen images can be captured, and the oscilloscope can be operated remotely. Also, SCPI (Standard Commands for Programmable Instrumentation) commands can be sent over the LAN. Microsoft Internet Explorer 6 is the recommended Web browser for communication and control of the oscilloscope.
Getting Started 1 possible to use a point-to-point connection (see page 42), but using a LAN is the preferred method. 2 Type the oscilloscope’s hostname or IP address in the web browser. 3 When the oscilloscope’s Web page is displayed, select Browser Web Control, then select Remote Front Panel. After a few seconds the Remote Front Panel appears. NOTE If Java is not installed on your PC, you will be prompted to install the Sun Microsystems Java Plug-in.
1 Getting Started Setting a password Whenever you connect the oscilloscope to a LAN, it is good practice to set a password to prevent unauthorized access to the oscilloscope via Web browser. 1 Select the Configure Network tab from the instrument’s Welcome page.
Getting Started 1 2 Select the Modify Configuration button. Step 3 3 Enter your desired password, and click Apply Changes. 4 To reset the password: • 6000A Series oscilloscopes - Press Utility & I/O & LAN Reset. • 6000L Series oscilloscopes - Press the LAN RESET button on the front panel.
1 Getting Started Main Menu Function Keys Hint appears when you roll over with mouse Softkeys (Left-click to select, Rightclick for Quick Help 48 6000 Series Oscilloscope User’s Guide
Getting Started 1 Scrolling and Monitor Resolution When using a monitor resolution of 1024 x 768 or less on the remote computer, you need to scroll to access the full remote front panel. To display the remote front panel without scroll bars, use a monitor resolution greater than 1024 x 768 on your computer’s display. Identify Function Select Identification on button on the oscilloscope’s web page.
1 Getting Started Printing the oscilloscope’s display from a web browser To print the oscilloscope’s display from a web browser: 1 Establish a connection to the oscilloscope as described in this chapter and go to the oscilloscope’s Welcome page. 2 Select the Get Image tab from the left side of the Welcome screen. After a delay of several seconds, the oscilloscope’s screen image will be displayed. 3 Right-click on the image and select “Save Picture As...”.
Getting Started 1 To connect the oscilloscope probes The analog input impedance of the 100 MHz oscilloscopes is fixed at 1 MΩ . The 1 MΩ mode is for use with many passive probes and for general purpose measurements. The high impedance minimizes the loading effect of the oscilloscope on the circuit under test. If a 50 Ω input impedance is required, attach a 50 ohm feedthrough termination adapter such as Agilent part number 0960-0301 to the oscilloscope’s channel input BNC connector.
1 Getting Started WA R N I N G Do not negate the protective action of the ground connection to the oscilloscope. The oscilloscope must remain grounded through its power cord. Defeating the ground creates an electric shock hazard. CAUTION Maximum input voltage for analog inputs CAT I 300 Vrms, 400 Vpk; transient overvoltage 1.
Getting Started 1 5 You should see a waveform on the oscilloscope’s display similar to this: If you see the waveform, but the square wave is not shaped correctly as shown above, perform the procedure “To compensate the oscilloscope probes” on page 54. If you do not see the waveform, ensure your power source is adequate, the oscilloscope is properly powered-on, and the probe is connected securely to the front-panel oscilloscope channel input BNC and to the Probe Comp terminal.
1 Getting Started To compensate the oscilloscope probes You should compensate your oscilloscope probes to match their characteristics to the oscilloscope’s channels. A poorly compensated probe can introduce measurement errors. 1 Perform the procedure “To verify basic oscilloscope operation” on page 52. 2 Use a nonmetallic tool to adjust the trimmer capacitor on the probe for the flattest pulse possible. The trimmer capacitor is located on the probe BNC connector.
Getting Started 1 To calibrate the probes The oscilloscope can accurately calibrate its analog oscilloscope channels to certain active probes, such as InfiniiMax probes. Other probes, such as the 10073C and 10074C passive probes, do not require calibration. The Calibrate Probe softkey will be grayed-out (displayed in faint text) when a connected probe does not require calibration.
1 Getting Started Active Probes Supported By 300 MHz, 500 MHz, and 1 GHz Bandwidth Models Active probes that do not have their own external power supply require substantial power from the AutoProbe interface. (The AutoProbe interface is present on the 300 MHz, 500 MHz, and 1 GHz bandwidth models.) “Quantity Supported” indicates the maximum number of each type of active probe that can be connected to the oscilloscope.
Getting Started 1 By 100 MHz Bandwidth Models The following active probes use their own power supply. Therefore, they can be used on all 6000 Series oscilloscopes, including the 100 MHz bandwidth models. Many active probes have a 50 Ω output impedance. The input impedance of 6000 Series 100 MHz bandwidth models is fixed at 1 MΩ. When connecting these probes to 6000 Series 100 MHz bandwidth models, a 50 Ω feedthrough terminator (such as Agilent part number 0960-0301 is required).
1 Getting Started Using Quick Help To view Quick Help on 6000L Series oscilloscopes: Start a Web browser control session as described on page 44 and select Remote Front Panel. To view Quick Help information, right-click on the softkey. Help is not available for front panel keys; only softkeys. To view Quick Help on 6000A Series oscilloscopes 1 Press and hold down the key or softkey for which you would like to view help.
Getting Started 1 Quick Help Languages At the time this manual was published, Quick Help was available in English, Simplified Chinese, Japanese, German, French, and Russian. To choose a Quick Help language in the oscilloscope: 1 Press Utility, then press the Language softkey. 2 Repeatedly press and release the Language softkey or rotate the Entry knob until the desired language is selected.
1 60 Getting Started 6000 Series Oscilloscope User’s Guide
Agilent 6000 Series Oscilloscope User’s Guide 2 Front-Panel Controls 6000L Series Oscilloscope Controls 62 6000A Series Oscilloscope Front-Panel Controls 66 6000A Series Front-Panel Operation 76 Agilent Technologies 61
2 Front-Panel Controls 6000L Series Oscilloscope Controls The 6000L Series oscilloscope is designed to be remotely controlled. Therefore the front panel layout is simple.
Front-Panel Controls 2 Front and Rear Panel Controls and Connectors 1. Power Switch Press once to switch power on; press again to switch power off. See page 33. 2. Power Indicator Illuminates green when power is on. 3. LAN Status Indicator This indicator illuminates green when a LAN connection has been detected and is connected as configured.
2 Front-Panel Controls CAUTION Only connect USB devices to the USB host port. Do not attempt to connect a host computer to this port to control the oscilloscope. Use the USB device port if you want to connect a host (see the InfiniiVision 6000 Series Oscilloscope Programmer’s Quick Start Guide for details). 7. Probe Compensation Terminals Use the signal at these terminals to match each probe’s characteristics to the oscilloscope channel to which it is connected. See page 54. 8.
Front-Panel Controls 2 15. Digital Channels Input If you purchased the MSO upgrade you can view and trigger on digital signals. See page 111. 16. USB Host Port Connect a USB compliant mass storage device to store or recall oscilloscope setup files or waveforms. You can also use the USB port to update the oscilloscope’s system software or Quick Help language files if updates are available.
2 Front-Panel Controls 6000A Series Oscilloscope Front-Panel Controls This is an introduction to the front-panel controls of the Agilent 6000A Series oscilloscope. Generally, you set up the front-panel controls and then make a measurement. The keys on the front panel bring up softkey menus on the display that provide access to oscilloscope features. Many softkeys use the Entry knob to select values. Six softkeys are located below the display.
Front-Panel Controls 2 Conventions Throughout this book, the front-panel keys and softkeys are denoted by a change in font. For example, the Cursors key is in the Measure section of the front panel. The Acq Mode softkey is the left-most softkey when the Acquire menu is displayed. In this manual, instructions for pressing a series of keys are written in an abbreviated manner.
2 Front-Panel Controls 4-Channel 6000A Series Oscilloscope Front Panel The following diagram shows the front panel of the 6000A Series 4-channel oscilloscopes. The controls of the 2-channel oscilloscopes are very similar. For a diagram showing the differences of the 2-channel oscilloscope, see page 74.
Front-Panel Controls 2 Front Panel Controls 1. Power Switch Press once to switch power on; press again to switch power off. See page 33. 2. Intensity Control Rotate clockwise to increase analog waveform intensity; counterclockwise to decrease. You can vary the intensity control to bring out signal detail, much like an analog oscilloscope. Digital channel waveform intensity is not adjustable. More details about using the Intensity control to view signal detail are on page 263. 3.
2 Front-Panel Controls 6. Vertical Position Control Use this knob to change the channel’s vertical position on the display. There is one Vertical Position control for each channel. See “Using the analog channels” on page 83. 7. Channel On/Off Key Use this key to switch the channel on or off, or to access the channel’s menu in the softkeys. There is one Channel On/Off key for each channel. See “Using the analog channels” on page 83. 8.
Front-Panel Controls 2 14. Utility Key Press this key to access the Utility menu, which lets you configure the oscilloscope’s I/O settings, printer configuration, file explorer, service menu, and other options. 15. Trigger Controls These controls determine how the oscilloscope triggers to capture data. See “Choosing Auto trigger mode or Normal trigger mode” on page 80 and Chapter 4, “Triggering the Oscilloscope,” starting on page 127. 16.
2 Front-Panel Controls Run mode) then you are looking at the waveform data from the last acquisition taken. See “To set up the Horizontal time base” on page 88. 19. Horizontal Menu/Zoom Key (Labeled Main/Delayed on older models.) Press this key to access the menu where you can split the oscilloscope display into Main and Zoom sections, and where you can select XY and Roll modes. You can also select horizontal time/division vernier and select the trigger time reference point on this menu.
Front-Panel Controls 2 24. AutoScale Key When you press the AutoScale key the oscilloscope will quickly determine which channels have activity, and it will turn these channels on and scale them to display the input signals. See “How AutoScale Works” on page 312 25. Softkeys The functions of these keys change based upon the menus shown on the display directly above the keys.
2 Front-Panel Controls 2-Channel 6000A Series Oscilloscope Front Panel (differences only) External Trigger Input Figure 7 6000A Series 2-Channel Oscilloscope Front Panel The differences between the front panel of the 4-channel oscilloscopes and the 2-channel oscilloscopes are: • The 2-channel oscilloscope has two sets of channel controls • The 2-channel oscilloscope’s external trigger input is on the front panel instead of the rear panel. Some trigger features differ.
Front-Panel Controls 2 Interpreting the display The oscilloscope display contains acquired waveforms, setup information, measurement results, and softkeys for setting up parameters.
2 Front-Panel Controls 6000A Series Front-Panel Operation This section provides a brief overview of operating the front-panel controls. Detailed oscilloscope operating instructions are provided in later chapters. Digital Channels Because all of the oscilloscopes in the 6000 Series have analog channels, the analog channel topics in this book apply to all instruments.
Front-Panel Controls NOTE 2 To change the analog waveform intensity, turn the Intensity knob at the lower-left corner of the front panel. The digital waveform intensity is not adjustable. To start and stop an acquisition • When you press the Run/Stop key, it illuminates in green and the oscilloscope is in continuous running mode. The oscilloscope examines the input voltage at each probe, and updates the display whenever the trigger conditions are met.
2 Front-Panel Controls Memory Depth/Record Length Run/Stop versus Single When the oscilloscope is running, the trigger processing and update rate are optimized over the memory depth. Single Single acquisitions always use the maximum memory available—at least twice as much memory as acquisitions captured in Run mode—and the oscilloscope stores at least twice as many samples.
Front-Panel Controls 2 2 If you are triggering on analog channel events, turn the Trigger Level knob to the trigger threshold to a level that your waveform will cross. 3 To begin a single acquisition, press the Single key. When you press Single, the display is cleared, the trigger circuitry is armed, the Single key is illuminated yellow, and the oscilloscope will wait until a trigger condition occurs before it displays a waveform.
2 Front-Panel Controls 3 Turn the Horizontal Position knob ( ) to pan horizontally and turn the channel’s vertical position knob ( ) to pan vertically. The stopped display may contain several triggers worth of information, but only the last trigger acquisition is available for pan and zoom. For more information about Pan and Zoom see page 258. Choosing Auto trigger mode or Normal trigger mode In Auto trigger mode, the oscilloscope automatically triggers and captures waveforms when you press Run.
Front-Panel Controls 2 To make the oscilloscope remain in the acquisition mode you have chosen, press the AutoScale Acq Mode softkey and select Preserve Acquisition Mode. Otherwise, the acquisition mode will default to Normal whenever the AutoScale key is pressed. Example Connect the oscilloscope probes for channels 1 and 2 to the Probe Comp output on the front panel of the instrument. Be sure to connect the probe ground leads to the ground lug beside the Probe Comp output.
2 Front-Panel Controls around the oscilloscope’s BNC connector. Therefore, the oscilloscope will automatically set the attenuation factor for recognized Agilent passive probes. Passive probes that do not have a pin that connects to the ring around the BNC connector will not be recognized by the oscilloscope, and you must set the probe attenuation factor manually. Active Probes All 6000 Series oscilloscopes except the 100 MHz bandwidth models (MSO/DSO6012A and MSO/DSO6014A/L) have an AutoProbe interface.
Front-Panel Controls 2 Using the analog channels Connect the oscilloscope probes for channels 1 and 2 to the Probe Comp output on the front panel of the instrument. 1 Press the 1 key in the Analog section of the oscilloscope’s front panel to display the Channel 1 menu.
2 Front-Panel Controls Turning channels off You must be viewing the menu for a channel before you can turn it off. For example, if channel 1 and channel 2 are turned on and the menu for channel 2 is being displayed, to turn channel 1 off, press 1 to display channel 1 menu, then press 1 again to turn channel 1 off. Vertical sensitivity Turn the large knob above the channel key to set the sensitivity (volts/division) for the channel.
Front-Panel Controls 2 Measurement Hints If the channel is DC coupled, you can quickly measure the DC component of the signal by simply noting its distance from the ground symbol. If the channel is AC coupled, the DC component of the signal is removed, allowing you to use greater sensitivity to display the AC component of the signal. 2 Press the channel’s on/off key, then press the Coupling softkey to select the input channel coupling.
2 Front-Panel Controls • 50 Ohm mode matches 50-ohm cables commonly used in making high frequency measurements, and 50-ohm active probes. This impedance matching gives you the most accurate measurements since reflections are minimized along the signal path. When 50 Ohm is selected, “50Ω” is illuminated on the front panel next to the channel position knob. The oscilloscope automatically switches to 1 M Ohm mode to prevent possible damage if AC coupling is selected.
Front-Panel Controls 2 6 Press the Probe softkey to display the channel probe menu. This menu lets you select additional probe parameters such as attenuation factor and units of measurement for the connected probe. Probe calibration not needed, not available when this softkey is ghosted. Measurement Attenuation factor units Skew adjust Calibrate probe Return to previous menu • Probe Units — Press the Units softkey to select the proper measurement unit for the connected probe.
2 Front-Panel Controls • Calibrate Probe — See “To calibrate the probes” on page 55. To set up the Horizontal time base 1 Press the Menu/Zoom key (labeled Main/Delayed on older models) in the Horizontal section of the front panel. To manually control the horizontal time base on 6000L models start the Remote Front Panel (see page 44) and select Horizontal from the Main Menu or press ctrl+N.
Front-Panel Controls 2 2 Turn the large knob (time/division) in the Horizontal section and notice the change it makes to the status line. When the oscilloscope is running in Main mode, use the large Horizontal knob to change sweep speed and use the small knob ( ) to set the horizontal position. When the oscilloscope is stopped, use these knobs to pan and zoom your waveform. The sweep speed (seconds/division) value is displayed in the status line.
2 Front-Panel Controls • When the horizontal mode is set to Main, the horizontal position knob positions the main sweep relative to the trigger. This delay is a fixed number. Changing this delay value does not affect the sweep speed. • When the horizontal mode is set to Zoom, the horizontal position knob controls the position of the Zoom sweep window inside the main sweep display. This delay value is independent of sampling interval and sweep speed.
Front-Panel Controls 2 Zoom mode Zoom sweep is an expanded version of main sweep. When Zoom mode is selected, the display divides in half and the Zoom sweep icon displays in the middle of the line at the top of the display. The top half of the display shows the main sweep and the bottom half displays the Zoom sweep. Zoom sweep is a magnified portion of the main sweep.
2 Front-Panel Controls These markers define the beginning and end of the Zoom sweep window Time/div for Zoom sweep Time/div for main sweep Delay time momentarily displays when the horizontal position knob is turned Main sweep window Zoom sweep window Select main or Zoom sweep The area of the main display that is expanded is intensified and marked on each end with a vertical marker. These markers show what portion of the main sweep is expanded in the lower half.
Front-Panel Controls 2 To change the sweep speed for the Zoom sweep window, turn the sweep speed knob. As you turn the knob, the sweep speed is highlighted in the status line above the waveform display area. The time reference position sets the initial position of the trigger event within acquisition memory and on the display, with delay (horizontal position) set to 0. The delay setting sets the specific location of the trigger event with respect to the time reference position.
2 Front-Panel Controls • In Roll mode there is no trigger. The fixed reference point on the screen is the right edge of the screen and refers to the current moment in time. Events that have occurred are scrolled to the left of the reference point. Since there is no trigger, no pre-trigger information is available. If you would like to pause the display in Roll mode press the Single key. To clear the display and restart an acquisition in Roll mode, press the Single key again.
Front-Panel Controls 2 To make cursor measurements You can use the cursors to make custom voltage or time measurements on oscilloscope signals, and timing measurements on digital channels. • To manually control Cursors on 6000L models start the Remote Front Panel (see page 44) and select Measure from the Main Menu or press ctrl+C to access the oscilloscope’s Cursors Menu. 1 Connect a signal to the oscilloscope and obtain a stable display. 2 Press the Cursors key.
2 Front-Panel Controls To make automatic measurements You can use automatic measurements on any channel source or any running math function. Cursors are turned on to focus on the most recently selected measurement (right-most on the measurement line above the softkeys on the display). 1 Press the Quick Meas key to display the automatic measurement menu.
Front-Panel Controls 2 Using Labels You can define labels and assign them to each analog input channel, or you can turn labels off to increase the waveform display area. Labels can also be applied to digital channels on MSO models. To turn the label display on or off 1 Press the Label key on the front panel. This turns on display labels for the analog and digital channels. When the Label key is illuminated, the labels for displayed channels are displayed at the left edge of the displayed traces.
2 Front-Panel Controls To assign a predefined label to a channel 1 Press the Label key. 2 Press the Channel softkey, then turn the Entry knob or successively press the Channel softkey to select a channel for label assignment. The figure above shows the list of channels and their default labels. The channel does not have to be turned on to have a label assigned to it.
Front-Panel Controls 2 To define a new label 1 Press the Label key. 2 Press the Channel softkey, then turn the Entry knob or successively press the softkey to select a channel for label assignment. The channel does not have to be turned on to have a label assigned to it. If the channel is turned on, its current label will be highlighted. 3 Press the Spell softkey, then turn the Entry knob to select the first character in the new label.
2 Front-Panel Controls To load a list of labels from a text file you create It may be convenient to create a list of labels using a text editor, then load the label list into the oscilloscope. This lets you type on a keyboard rather than edit the label list using the oscilloscope’s controls. You can create a list of up to 75 labels and load it into the oscilloscope. Labels are added to the beginning of the list. If more than 75 labels are loaded, only the first 75 are stored.
Front-Panel Controls 2 To reset the label library to the factory default 1 Press Utility&Options&Preferences. CAUTION Pressing the Default Library softkey will remove all user-defined labels from the library and set the labels back to the factory default. Once deleted, these user-defined labels cannot be recovered. 2 Press the Default Library softkey. This will delete all user-defined labels from the library and set the labels in the library back to the factory default.
2 Front-Panel Controls To set the clock The Clock menu lets you set the current date and time of day (24-hour format). This time/date stamp will appear on hardcopy prints and directory information on the USB mass storage device. To set the date and time, or to view the current date and time: 1 Press Utility&Options&Clock. Year set Month set Day set Hour set Minute set Return to previous menu 2 Press the Year, Month, Day, Hour or Minute softkey and rotate the Entry knob to set to the desired number.
Front-Panel Controls 2 To set up the screen saver NOTE The Screen Saver is disabled on 6000L models. The oscilloscope can be configured to turn on a display screen saver when the oscilloscope has been idle for a specified length of time. 1 Press Utility&Options&Preferences&Screen Saver to display the screen saver menu. Screen saver Screen saver image time delay Preview Return to previous menu 2 Press the Saver softkey to select the screen saver type.
2 Front-Panel Controls 3 Turn the Entry knob to select the number of minutes to wait before the selected screen saver activates. When you turn the Entry knob, the number of minutes is displayed in the Wait softkey. The default time is 180 minutes (3 hours). 4 Press the Preview softkey to preview the screen saver you have selected with the Saver softkey. 5 To view the normal display after the screen saver has started, press any key or turn any knob.
Front-Panel Controls 2 To perform service functions • Press the Utility&Service to display the service menu. Start User Cal Start Self Test About Oscilloscope User Cal status Return to previous menu The Service Menu lets you: • Perform User Cal on the oscilloscope. • View User Cal status. • Perform instrument Self Test. • View information about your oscilloscope model number, code revision information, and User Cal status.
2 Front-Panel Controls Performing User Cal will invalidate your Certificate of Calibration. If NIST (National Institute of Standards and Technology) traceability is required, perform the Performance Verification procedure in the Agilent InfiniiVision 6000 Series Oscilloscopes Service Guide using traceable sources. To perform User Cal 1 Set the rear-panel CALIBRATION switch to UNPROTECTED.
Front-Panel Controls 2 For a 4-channel oscilloscope, connect BNC tees to the equal-length cables as shown below. Then connect a BNC(f)-to-BNC(f) (barrel connector) to the tee as shown below. To Channel 1 To Channel 2 To Channel 3 To Channel 4 Figure 11 Longer cable to TRIG OUT User Calibration cable for 4-channel oscilloscope 1 Connect a BNC cable (40 inches maximum) from the TRIG OUT connector on the rear panel to the BNC barrel connector. 2 Press the Utility key, then press the Service softkey.
2 Front-Panel Controls probes do not need to be calibrated, but InfiniiMax probes can be calibrated. For more information about calibrating probes see page 55. Results: User Cal date: Change in temperature since last User Cal: Failure: Comments: Probe Cal Status: Self Test Pressing Utility&Service&Start Self Test performs a series of internal procedures to verify that the oscilloscope is operating properly. It is recommended you run Self Test: • after experiencing abnormal operation.
Front-Panel Controls 2 Installed licenses: This line in the About This Oscilloscope dialog contains information about the licenses that have been installed on the oscilloscope. For example, it can show: • 232 — UART (Universal Asynchronous Receiver/Transmitter) and RS232 (Recommended Standard 232) trigger and decode. This license provides trigger and decode capability for many UART protocols including RS232. • ALT — Altera FPGA Dynamic Probe.
2 Front-Panel Controls To restore the oscilloscope to its default configuration • Press the Save/Recall key, then press the Default Setup softkey. The default configuration returns the oscilloscope to its default settings. This places the oscilloscope in a known operating condition. The major default settings are: Horizontal main mode, 100 µs/div scale, 0 s delay, center time reference. Vertical (Analog) Channel 1 on, 5 V/div scale, DC coupling, 0 V position, 1 MΩ impedance, probe factor to 1.
Agilent 6000 Series Oscilloscope User’s Guide 3 Viewing and Measuring Digital Signals To connect the digital probes to the circuit under test 112 Acquiring waveforms using the digital channels 115 To display digital channels using AutoScale 116 Interpreting the digital waveform display 118 To switch all digital channels on or off 119 To switch groups of channels on or off 119 To switch a single channel on or off 119 To change the displayed size of the digital channels 120 To reposition a digital channel 12
3 Viewing and Measuring Digital Signals To connect the digital probes to the circuit under test The digital channels are enabled on MSO6000 models and DSO6000 models which have the MSO upgrade license installed. 1 If you feel it’s necessary, turn off the power supply to the circuit under test. Turning off power to the circuit under test would only prevent damage that might occur if you accidentally short two lines together while connecting probes.
Viewing and Measuring Digital Signals 3 the oscilloscope. Snap the wide end of the cable guide in place, being careful not to pinch the cable. 4 Connect the ground lead on each set of channels (each pod), using a probe grabber. The ground lead improves signal fidelity to the oscilloscope, ensuring accurate measurements. Channel Pod Ground Circuit Ground 5 Connect a grabber to one of the probe leads. (Other probe leads are omitted from the figure for clarity.
3 Viewing and Measuring Digital Signals 6 Connect the grabber to a node in the circuit you want to test. 7 For high-speed signals, connect a ground lead to the probe lead, connect a grabber to the ground lead, and attach the grabber to ground in the circuit under test.
Viewing and Measuring Digital Signals 3 8 Repeat steps 3 through 6 until you have connected all points of interest. Signals Ground Acquiring waveforms using the digital channels When you press Run/Stop or Single to run the oscilloscope, the oscilloscope examines the input voltage at each input probe. When the trigger conditions are met the oscilloscope triggers and displays the acquisition.
3 Viewing and Measuring Digital Signals To display digital channels using AutoScale When signals are connected to the digital channels, AutoScale quickly configures and displays the digital channels. • To configure the instrument quickly, press the AutoScale key. Any digital channel with an active signal will be displayed. Any digital channels without active signals will be turned off. • To undo the effects of AutoScale, press the Undo AutoScale softkey before pressing any other key.
Viewing and Measuring Digital Signals 3 configuration by pressing the Save/Recall key, then the Default Setup softkey. Then press the AutoScale key. You should see a display similar to the following.
3 Viewing and Measuring Digital Signals Interpreting the digital waveform display The following figure shows a typical display with digital channels.
Viewing and Measuring Digital Signals 3 To switch all digital channels on or off 1 Press the D15 Thru D0 key to switch the display of the digital channels on or off. The Digital Channel Menu will be displayed above the softkeys. On 6000L models select Digital from the main menu or press ctrl+D. The digital channels are displayed when this key on the 6000A models is illuminated.
3 Viewing and Measuring Digital Signals To change the displayed size of the digital channels 1 Press the D15 Thru D0 key. 2 Press the size ( ) softkey to select how the digital channels are displayed. The sizing control lets you spread out or compress the digital traces vertically on the display for more convenient viewing. To reposition a digital channel 1 The Digital Select key is located on the front panel, just to the right of the display.
Viewing and Measuring Digital Signals 3 function changes depending on which menu is displayed. For example, when assigning Labels on digital channels the Entry knob selects the channel to which the Label will be applied. To change the logic threshold for digital channels 1 Press the D15 Thru D0 key so that the Digital Channel Menu is displayed. 2 Press the Thresholds softkey 3 Press the D15 - D8 or D7 - D0 softkey, then select a logic family preset or select User to define your own threshold.
3 Viewing and Measuring Digital Signals To display digital channels as a bus Digital channels may be grouped and displayed as a bus, with each bus value displayed at the bottom of the display in hex or binary. You can create up to two busses. To configure and display each bus, press the D15 Thru D0 key on the front panel (just to the right of the display). Then press the Bus softkey. Bus softkey Next, select a bus by rotating the Entry knob, then press the Bus1/Bus2 softkey to switch it on.
Viewing and Measuring Digital Signals 3 The buses are shown at the bottom of the display. Bus values can be shown i n hex or binary Using cursors to read bus values To read the digital bus value at any point using the cursors: 1 Switch on Cursors (by pressing the Cursor key on the front panel) 2 Press the cursor Mode softkey and change the mode to Hex or Binary. 3 Press the Source softkey and select Bus1 or Bus2.
3 Viewing and Measuring Digital Signals 4 Use the Entry knob and the X1 and X2 softkeys to position the cursors where you want to read the bus values. X1 cursor X2 cursor Bus values Bus values at cursors shown here Set mode to Binary or Hex Select Bus1 or Bus2 source When you press the D15 Thru D0 key to display the Digital Channel Menu, the digital activity indicator is shown where the cursor values were and the bus values at the cursors are displayed in the graticule.
Viewing and Measuring Digital Signals 3 Bus values are displayed when using Pattern trigger The bus values are also displayed when using the Pattern trigger function. Press the Pattern key on the front panel to display the Pattern Trigger Menu and the bus values will be displayed on the right, above the softkeys. The dollar sign ($) will be displayed in the bus value when the bus value can not be displayed as a hex value.
3 126 Viewing and Measuring Digital Signals 6000 Series Oscilloscope User’s Guide
Agilent 6000 Series Oscilloscope User’s Guide 4 Triggering the Oscilloscope Selecting Trigger Modes and Conditions 130 The External Trigger input 136 Trigger Types 139 To use Edge triggering 140 To use Pulse Width triggering 142 To use Pattern triggering 145 To use CAN triggering 148 To use Duration triggering 152 To use I2C triggering 164 To use Nth Edge Burst triggering 170 To use LIN triggering 172 To use Sequence triggering 175 To use SPI triggering 182 To use TV triggering 187 To use UART/RS232 trigge
4 Triggering the Oscilloscope The Agilent InfiniiVision 6000 Series oscilloscopes provide a full set of features to help automate your measurement tasks. MegaZoom technology lets you capture and examine untriggered waveforms. With these oscilloscopes you can: • Modify the way the oscilloscope acquires data. • Set up simple or complex trigger conditions as needed, to capture only the sequence of events you want to examine.
Triggering the Oscilloscope 4 • Trigger Out connector NOTE Adding options such as the Low Speed Serial (LSS) or Automotive Serial (AMS) serial decode feature to the oscilloscope will add more trigger features to the relevant trigger types (I2C and SPI, or CAN and LIN). Adding option FRS (FlexRay serial decode) will add FlexRay to the trigger types. See “Using Serial Decode” on page 271 for more information.
4 Triggering the Oscilloscope Selecting Trigger Modes and Conditions The trigger mode affects the way in which the oscilloscope searches for the trigger. The figure below shows the conceptual representation of acquisition memory. Think of the trigger event as dividing acquisition memory into a pre-trigger and post-trigger buffer. The position of the trigger event in acquisition memory is defined by the time reference point and the delay (horizontal position) setting.
Triggering the Oscilloscope 4 Trigger modes: Normal and Auto An introduction to Normal and Auto trigger modes is given on page 80. 1 Press the Mode/Coupling key. 2 Press the Mode softkey, then select Normal or Auto. • Normal mode displays a waveform when the trigger conditions are met, otherwise the oscilloscope does not trigger and the display is not updated. • Auto mode is the same as Normal mode, except it forces the oscilloscope to trigger if the trigger conditions are not met.
4 Triggering the Oscilloscope Normal mode Use Normal trigger mode for low repetitive-rate signals or when Auto trigger is not required. In Normal mode the oscilloscope must fill the pre-trigger buffer with data before it will begin searching for a trigger event. The trigger mode indicator on the status line flashes Trig’d? to indicate the oscilloscope is filling the pre-trigger buffer.
Triggering the Oscilloscope 4 To select trigger Coupling 1 Press the Mode/Coupling key. 2 Press the Coupling softkey, then select DC, AC, or LF Reject coupling. • DC coupling allows DC and AC signals into the trigger path. • AC coupling places a 10 Hz (3.5 Hz in 100 MHz bandwidth models) high-pass filter in the trigger path removing any DC offset voltage from the trigger waveform. The high-pass filter in the External Trigger input path is 3.5 Hz for all models.
4 Triggering the Oscilloscope • HF Reject adds a 50 kHz low-pass filter in the trigger path to remove high frequency components from the trigger waveform. You can use HF Reject to remove high-frequency noise, such as AM or FM broadcast stations or noise from fast system clocks, from the trigger path. To set Holdoff 1 Press the Mode/Coupling key. 2 Turn the Entry knob to increase or decrease the trigger holdoff time shown in the Holdoff softkey.
Triggering the Oscilloscope 4 Holdoff Operating Hints Holdoff keeps a trigger from occurring until after a certain amount of time has passed since the last trigger. This feature is valuable when a waveform crosses the trigger level multiple times during one period of the waveform. Without holdoff, the oscilloscope could trigger on each of the crossings, producing a confusing waveform. With holdoff set correctly, the oscilloscope always triggers on the same crossing.
4 Triggering the Oscilloscope The External Trigger input The External Trigger input can be used as a source in several of the trigger types. On 2-channel oscilloscopes, the external trigger BNC input is on the front panel and is labeled Ext Trigger. On 4-channel oscilloscopes, the external trigger BNC input is on the rear panel and is labeled Ext Trig. 2-Channel oscilloscope External Trigger input External Trigger Probe Settings You can set external trigger probe parameters as described below.
Triggering the Oscilloscope 4 When you connect an AutoProbe self-sensing probe, the oscilloscope will automatically configure your probe to the correct attenuation factor. Note that the AutoProbe feature is not available on 100 MHz bandwidth models. The probe correction factor must be set properly for measurements to be made correctly. Range The input voltage range can be set to 1.0 Volts or 8.0 Volts. When in current mode, the range is fixed at 1.0 Amps.
4 Triggering the Oscilloscope • 1M Ohm mode is for use with many passive probes and for general-purpose measurements. The higher impedance minimizes the loading effect of the oscilloscope on the circuit under test. Probe Units Press the Units softkey to select the proper measurement unit for the connected probe. Select Volts for a voltage probe and select Amps for a current probe. Measurement results, channel sensitivity, and trigger level will reflect the measurement units you have selected.
Triggering the Oscilloscope 4 Trigger Types The oscilloscope lets you synchronize the display to the actions of the circuit under test by defining a trigger condition. You can use any input channel or the Ext Trigger BNC as the source for most trigger types. MegaZoom Technology Simplifies Triggering With the built-in MegaZoom technology, you can simply AutoScale the waveforms, then stop the oscilloscope to capture a waveform.
4 Triggering the Oscilloscope To use Edge triggering The Edge trigger type identifies a trigger by looking for a specified edge (slope) and voltage level on a waveform. You can define the trigger source and slope in this menu. The slope can be set to rising edge or falling edge, and can be set to alternating edges or either edge on all sources except Line. The trigger type, source, and level are displayed in the upper-right corner of the display.
Triggering the Oscilloscope NOTE 4 Alternating edge mode is useful when you want to trigger on both edges of a clock (for example, DDR signals). Either edge mode is useful when you want to trigger on any activity of a selected source. All modes operate up to the bandwidth of the oscilloscope except Either edge mode, which has a limitation. Either edge mode will trigger on Constant Wave signals up to 100 MHz, but can trigger on isolated pulses down to 1/(2*oscilloscope's bandwidth).
4 Triggering the Oscilloscope set the threshold level (TTL, CMOS, ECL, or user defined) for the selected digital channel group. The threshold value is displayed in the upper-right corner of the display. When Ext (External Trigger) is selected, its level can be adjusted using the Level knob in the Trigger section of the front panel. The trigger level is displayed in the upper right corner of the display. The line trigger level is not adjustable.
Triggering the Oscilloscope 4 The channel you select is shown in the upper-right corner of the display next to the polarity symbol. The source can be any analog or digital channel available on your oscilloscope. External trigger may also be specified as a source when using a 2-channel oscilloscope. Adjust the trigger level for the selected analog channel by turning the Trigger Level knob. Press the D15 Thru D0 key and select Thresholds to set the threshold level for digital channels.
4 Triggering the Oscilloscope For example, for a positive pulse, if you set t>10 ns: 10 ns 10 ns Trigger • within a range of time values (><). For example, for a positive pulse, if you set t>10 ns and t<15 ns: 10 ns 15 ns 12 ns Trigger 5 Select the qualifier time set softkey (< or >), then rotate the Entry knob to set the pulse width qualifier time.
Triggering the Oscilloscope 4 To use Pattern triggering The Pattern trigger identifies a trigger condition by looking for a specified pattern. This pattern is a logical AND combination of the channels. Each channel can have a value of high (H), low (L), don't care (X). A rising or falling edge can be specified for one channel included in the pattern. You can also trigger on a hex bus value as described on page 147.
4 Triggering the Oscilloscope Adjust the trigger level for the selected analog channel by turning the Trigger Level knob. Press the D15 Thru D0 key and select Thresholds to set the threshold level for digital channels. The value of the trigger level or digital threshold is displayed in the upper-right corner of the display. 3 For each channel you select, press one of the condition softkeys to set the condition for that channel in the pattern. • H sets the pattern to high on the selected channel.
Triggering the Oscilloscope 4 Hex Bus Pattern Triggering You can specify a bus value on which to trigger. To do this, first define the bus. See “To display digital channels as a bus” on page 122 for details. You can trigger on a bus value whether you are displaying the bus or not. To trigger on a bus value: 1 Press the Pattern key on the front panel. 2 Press the Channel softkey and rotate the Entry knob to select Bus1 or Bus2.
4 Triggering the Oscilloscope To use CAN triggering NOTE For CAN decode setup see page 281. Controller Area Network (CAN) trigger will trigger on CAN version 2.0A and 2.0B signals. Setup consists of connecting the oscilloscope to a CAN signal, using the Settings menu to specify the event to trigger on, and using the Signals menu to specify the signal source, baud rate, and sample point. The oscilloscope will trigger on dominant-low CAN signals.
Triggering the Oscilloscope 4 softkey, then press the Settings softkey to display CAN trigger menu. Currently selected signal source Trigger level or threshold Bits Selector Return to previous menu CAN trigger Signals Menu Trigger condition 2 Repeatedly press and release the Trigger: softkey or rotate the Entry knob to select the trigger condition. • SOF - Start of Frame — The oscilloscope triggers at the start of a frame.
4 Triggering the Oscilloscope • Error Frame - The oscilloscope will trigger on CAN active error frames. • All Errors - The oscilloscope will trigger when any form error or active error is encountered. • Acknowledge Error - The oscilloscope will trigger when the acknowledge bit is recessive (high). • Overload Frame - The oscilloscope will trigger on CAN overload frames. 3 If necessary, press the up-arrow softkey to return to the CAN Trigger menu. Press the Signals softkey to enter the CAN Signals menu.
Triggering the Oscilloscope 4 5 Repeatedly press and release the Baud softkey to set the CAN signal baud rate to match your CAN bus signal. The CAN baud rate can be set to: 10 kb/s 20 kb/s 33.3 kb/s 50 kb/s 62.5 kb/s 83.3 kb/s 100 kb/s 125 kb/s 250 kb/s 500 kb/s 800 kb/s 1 Mb/s The default baud rate is 1 Mb/s 6 Repeatedly press and release the Smpl Pt softkey to select the point between phase segments 1 and 2 where the state of the bus is measured.
4 Triggering the Oscilloscope To use Duration triggering Duration trigger lets you define a pattern, then trigger on a specified time duration of this logical AND combination of the channels. 1 Press the More key in the Trigger section of the front panel, rotate the Entry knob until Duration is displayed in the Trigger softkey, then press the Settings softkey to display the Duration trigger menu.
Triggering the Oscilloscope 4 Adjust the trigger level for the selected analog channel by turning the Trigger Level knob. Press the D15 Thru D0 key and select Thresholds to set the threshold level for digital channels. The value of the trigger level or digital threshold is displayed in the upper-right corner of the display. 3 For each channel you select, press the logic level softkey to set the condition for that channel in the pattern. • H sets the pattern to high on the selected channel.
4 Triggering the Oscilloscope < qualifier time set softkey • When the less than (<) qualifier is selected, the Entry knob sets the oscilloscope to trigger on a pattern duration less than the time value displayed on the softkey. • When the within time range (><) qualifier is selected, the Entry knob sets the upper time range value. • When the out of time range (<>) qualifier is selected, the Entry knob sets the lower time range value.
Triggering the Oscilloscope 4 To use FlexRay triggering The N5432A FlexRay triggering and decode option, along with the Agilent VPT1000 protocol analyzer and its MSO communications cable, allow a 6000 Series mixed-signal oscilloscope to: • Control the VPT1000 (without a PC). • Trigger on FlexRay bus frames, times, or errors and correlate them with other signals in a device under test. • Display decoded FlexRay bus data.
4 Triggering the Oscilloscope Oscilloscope Controls the VPT1000, Synchronous Mode Monitoring You can see a synchronous and time-correlated display of segment and slot timing boundaries by importing a FIBEX (Field Bus Exchange format) file that defines the global FlexRay schedule. PC Controls the VPT1000 For more advanced FlexRay protocol analysis, the VPT1000 can be controlled by a PC and configured for either synchronous or asynchronous operation using J8130A Option 200 software.
Triggering the Oscilloscope 4 FlexRay trigger Mode Baud Rate Channel TDMA Struct VPT1000 Return to (Sync Mode) LAN Address previous menu Specifying the VPT1000 LAN Address This is necessary when the oscilloscope controls the VPT1000 (but not when a PC with J8130A Option 200 software controls the VPT1000). 1 From the VPT1000 Menu, press the LAN Address softkey to access the VPT1000 LAN Addresses Menu.
4 Triggering the Oscilloscope Note that the VPT1000 is shipped pre-configured with an IP address of 192.168.80., and a subnet mask of 255.255.240.0. See the VPT1000 user manual for more information. 4 Set the oscilloscope’s IP address: 1 Press Utility&IO&Control. Deselect the LAN check box (turn it off). 2 Press the LAN Settings softkey. 3 Press the Config softkey. Deselect DHCP and AutoIP. 4 Press the Address softkey. Press the Modify softkey. Set the oscilloscope’s IP address to 192.168.
Triggering the Oscilloscope 4 In Asynchronous Mode 1 Press the Baud softkey to select a baud rate of 2.5 Mb/s, 5 Mb/s, or 10 Mb/s. 2 Press the Channel softkey to select channel A or B. In Synchronous Mode 1 Press the FIBEX File softkey to specify the location of the FIBEX (Field Bus Exchange format) file that defines the time-triggered timing schedule of the probed FlexRay bus. 2 Press the Channel softkey to select channel A or B.
4 Triggering the Oscilloscope Triggering on FlexRay Frames, Times, or Errors Accessing the FlexRay Trigger Menu 1 In the Trigger section on the front panel, press the More key. 2 Press the Trigger softkey, and use the Entry knob to select FlexRay. 3 Press the Settings softkey to access the FlexRay Trigger Menu.
Triggering the Oscilloscope 4 This is the cycle count in the frame header, not the instance in time where that cycle begins. 5 Press the Frame Type softkey to select the frame type value from: • All Frames • Startup Frames • NULL Frames • Sync Frames • Normal Frames • NOT Startup Frames • NOT NULL Frames • NOT Sync Frames 6 Press the Frame ID softkey, and use the Entry knob to select the frame ID value from All or 1 to 2047.
4 Triggering the Oscilloscope 4 Press the Cyc Ct Bas softkey, and use the Entry knob to select the cycle count base value from 0 through the Cyc Ct Rep value minus 1, or All. 5 Press the Segment softkey to select the type of segments from: • Static Segments • Dynamic Segments • Symbol Segments • Idle Segments 6 When Static or Dynamic Segments are selected: a Press the Slot # softkey, and use the Entry knob to select the time slot number value from 1 to 2047 or All.
Triggering the Oscilloscope 4 • TSS Violation — transmission start sequence violation. • Header CRC Error — cyclic redundancy check error in the header. • Frame CRC Error — cyclic redundancy check error in the frame. • Frame End Sequence Error — indicates that the FES has been violated. • Boundary Violation — frame received overlaps slot boundaries (synchronous monitoring mode only). • Network Idle Time Violation — frame received with NIT (synchronous monitoring mode only).
4 Triggering the Oscilloscope To use I2C triggering NOTE For I2C decode setup see page 272. An I2C (Inter-IC bus) trigger setup consists of connecting the oscilloscope to the serial data (SDA) line and the serial clock (SCL) line, then triggering on a stop/start condition, a restart, a missing acknowledge, an EEPROM data read, or on a read/write frame with a specific device address and data value.
Triggering the Oscilloscope 4 2 Press the Signals softkey to display the I2C signals menu. SCL Clock channel SDA Data channel Return to previous menu 3 Connect an oscilloscope channel to the SCL (serial clock) line in the circuit under test, then set the SCL clock channel softkey to that channel.
4 Triggering the Oscilloscope Data needs to be stable during the whole high clock cycle or it will be interpreted as a start or stop condition (data transitioning while the clock is high). 6 Return to the previous menu; then, press the Trigger: softkey to select one of the following I2C trigger conditions: • Start Condition — The oscilloscope triggers when SDA data transitions from high to low while the SCL clock is high.
Triggering the Oscilloscope 4 • EEPROM Data Read — The trigger looks for EEPROM control byte value 1010xxx on the SDA line, followed by a Read bit and an Ack bit. It then looks for the data value and qualifier set by the Data softkey and the Data is softkey. When this event occurs, the oscilloscope will trigger on the clock edge for the Ack bit after the data byte. This data byte does not need to occur directly after the control byte.
4 Triggering the Oscilloscope • Frame (Start: Addr7: Read: Ack: Data: Ack: Data2) or Frame (Start: Addr7: Write: Ack: Data: Ack: Data2) — The oscilloscope triggers on a read or write frame in 7-bit addressing mode on the 26th clock edge if all bits in the pattern match. For triggering purposes, a restart is treated as a start condition.
Triggering the Oscilloscope 4 Press the Data is softkey to set the oscilloscope to trigger when data is = (equal to), ≠ (not equal to), < (less than), or > (greater than) the data value set in the Data softkey. The oscilloscope will trigger on the clock edge for the Ack bit after the trigger event is found. This data byte does not need to occur directly after the control byte.
4 Triggering the Oscilloscope To use Nth Edge Burst triggering The Nth Edge Burst trigger lets you trigger on the Nth edge of a burst that occurs after an idle time. Idle Time Trigger Nth Edge Burst trigger set up consists of selecting the source, the slope of the edge, the idle time, and the number of the edge: 1 Press the More key in the Trigger section of the front panel, rotate the Entry knob until Nth Edge Burst is displayed in the Trigger softkey.
Triggering the Oscilloscope Assign channels Slope of edge 4 Currently selected Clock, Framing, or Data channel Nth Edge Burst trigger Trigger level or threshold Nth edge select Return to previous menu Idle time select 3 Press the Slope softkey to specify the slope of the edge. 4 Press the Idle softkey; then, turn the Entry knob to specify the idle time. 5 Press the Edge softkey; then, turn the Entry knob to which edge to trigger on.
4 Triggering the Oscilloscope To use LIN triggering NOTE For LIN decode information see page 288. LIN (Local Interconnect Network) trigger setup consists of connecting the oscilloscope to a serial LIN signal. LIN triggering will trigger on the rising edge at the Sync Break exit of the LIN single-wire bus signal that marks the beginning of the message frame. If the N5424A CAN/LIN Automotive Triggering and Decode option is installed on your oscilloscope, the Frame ID trigger type will also be available.
Triggering the Oscilloscope 4 1 Press the More key in the Trigger section of the front panel, rotate the Entry knob until LIN is displayed in the Trigger softkey. 2 Press the Settings softkey to display LIN trigger menu. Currently selected signal source Trigger level or threshold LIN trigger Trigger on: condition Signal baud rate Return to previous menu 3 Press the Trigger: softkey and choose to trigger on Sync Break or Frame ID.
4 Triggering the Oscilloscope 4 Press the Signals softkey. The LIN Signals Menu will be displayed. Source Menu Signal baud rate Sample Point Standard Selector Define Sync Break Return to previous menu 5 Press the Source softkey to select the channel connected to the LIN signal line. Adjust the trigger level for the selected analog channel by turning the Trigger Level knob. Press the D15 Thru D0 key and select Thresholds to set the threshold level for digital channels.
Triggering the Oscilloscope 4 To use Sequence triggering Sequence trigger lets you trigger the oscilloscope after finding a sequence of events. Defining a sequence trigger requires three steps: 1 Define an event to find before you search for the trigger. The “find” event can be a pattern, an edge from a single channel, or the combination of a pattern and a channel edge. 2 Define the trigger event.
4 Triggering the Oscilloscope Sequence trigger Selected Trigger level channel or threshold Sequence stage definitions Term definitions Channel select Stage select Find, Trigger on, or Reset condition Select term Define term Return to previous menu As you set stage, term, and channel definitions for the sequence trigger, these settings will be shown in the waveform area of the display.
Triggering the Oscilloscope 4 Define the Find: stage 1 Press the Stage softkey and select Find:. Find: is the first stage in the trigger sequence. When you select the Stage Find softkey, the next softkey to the right will display Find: and give you a list of the terms you can define for the Find stage. The Find stage can be set to one of the following conditions: • Pattern 1 Entered — A pattern is entered on the last edge that makes the pattern true (logical AND).
4 Triggering the Oscilloscope • X sets the pattern to don't care on the selected channel. Any channel set to don't care is ignored and is not used as part of the pattern. If all channels in the pattern are set to don't care, the oscilloscope will not trigger. Adjust the trigger level for the selected analog channel by turning the Trigger Level knob. Press the D15 Thru D0 key and select Thresholds to set the threshold level for digital channels.
Triggering the Oscilloscope 4 • Pattern 2 Entered — A pattern is entered on the last edge that makes the pattern true (logical AND). • Pattern 2 Exited — A pattern is exited on the first edge that makes the pattern false (logical NAND). • Edge 2 • Pattern 2 and Edge 2 • Nth Edge 2 • Nth Edge 2 (no re-find) 2 Press the Trigger: softkey and select a stage to trigger on.
4 Triggering the Oscilloscope When Nth Edge 2 (no re-find) is selected, if the Find event occurs again before the Count (N) event is satisfied, the Count (N) is not reset to zero. b Press the Term softkey and select Count (N). c Press the N softkey, then turn the Entry knob to set the number of edges to wait before triggering. N can be set from 1 to 10,000. If the term(s) used in the “Trigger on:” Sequence Stage condition are set to “don’t care,” the oscilloscope will not trigger.
Triggering the Oscilloscope 4 5 If you select a pattern term, each channel in the pattern must be set to a H (high), L (low), or X (don't care). a Press the Channel softkey (or rotate the Entry knob on mixed-signal oscilloscopes) to select the channel. b Press the L H X softkey to set a level for the channel. c Repeat for all channels in the pattern. 6 If you select an edge term, one channel must be set to a rising edge or a falling edge. All other channel edges will be set to don’t care (X).
4 Triggering the Oscilloscope To use SPI triggering NOTE For SPI decode information see page 276. Serial Peripheral Interface (SPI) trigger setup consists of connecting the oscilloscope to a clock, data, and framing signal. You can then trigger on a data pattern that occurs at the start of a frame. The serial data string can be specified to be from 4 to 32 bits long.
Triggering the Oscilloscope Currently selected Clock, Framing, or Data channel SPI trigger 4 Trigger level or threshold Graphic showing current state of the SPI trigger setup Data string values Assign channels 6000 Series Oscilloscope User’s Guide # data bits in string Data bit select Data bit value Set all data bits to value Return to previous menu 183
4 Triggering the Oscilloscope Assign source channels to the clock, data, and frame signals 1 Press the Signals softkey to access SPI trigger settings for clock source and slope, data source, and frame type and source. Clock channel Clock slope Data channel Frame by condition Frame channel Return to previous menu 2 Press the Clock softkey or turn the Entry knob to select the channel connected to the SPI serial clock line.
Triggering the Oscilloscope 4 Labels automatically set for clock, data, and chip select signals Graphic showing current state of SPI trigger clock slope and chip select polarity or timeout selection 4 Press the Data softkey or turn the Entry knob to select the channel that is connected to the SPI serial data line. (If the channel you selected is off, switch it on.
4 Triggering the Oscilloscope You can set the oscilloscope to trigger during a high chip select (CS), a low chip select (~CS), or after a Timeout period during which the clock signal has been idle. • If the framing signal is set to CS (or ~CS), the first clock edge as defined, rising or falling, seen after the CS (or ~CS) signal transitions from low to high (or high to low) is the first clock in the serial stream.
Triggering the Oscilloscope 4 The Timeout value can be set anywhere from 100 ns to 10 s. 6 Press the up-arrow softkey to return to the previous menu. Set up the number of bits in the serial data string and set values for those data bits 1 Press the #Bits softkey, and turn the Entry knob to set the number of bits (#Bits) in the serial data string. The number of bits in the string can be set anywhere from 4 bits to 32 bits.
4 Triggering the Oscilloscope The oscilloscope’s MegaZoom III technology gives you bright, easily viewed displays of any part of the video waveform. Analysis of video waveforms is simplified by the oscilloscope’s ability to trigger on any selected line of the video signal. 1 Press the More key in the Trigger section of the front panel. If TV is not selected, rotate the Entry knob until TV is displayed in the Trigger softkey, then press the Settings softkey to display TV trigger menu.
Triggering the Oscilloscope 4 The selected trigger source is displayed in the upper-right corner of the display. Turning the Trigger Level knob does not change the trigger level because the trigger level is automatically set to the sync pulse. Trigger coupling is automatically set to TV in the Trigger Mode/Coupling menu. Provide Correct Matching Many TV signals are produced from 75 Ω sources.
4 Triggering the Oscilloscope • Line — Trigger on the selected line # (EDTV and HDTV standards only). • Line: Field1 and Line:Field2 — Trigger on the selected line # in field 1 or field 2 (interlaced standards only except 1080i). • Line: Alternate — Alternately trigger on the selected line # in field 1 and field 2 (NTSC, PAL, PAL-M, and SECAM only).
Triggering the Oscilloscope Table 12 4 Line (or count for Generic) numbers per field for each non-HDTV/EDTV video standard Video standard NTSC PAL PAL-M SECAM Generic Field 1 1 to 263 1 to 313 1 to 263 1 to 313 1 to 1024 Field 2 1 to 262 314 to 625 264 to 525 314 to 625 1 to 1024 Alt Field 1 to 262 1 to 312 1 to 262 1 to 312 1 to 1024 (vertical) Line Number Represents Count In Generic mode, the line number represents the number of a count instead of a real line number.
4 Triggering the Oscilloscope One example of triggering on a specific line of video is looking at the vertical interval test signals (VITS), which are typically in line 18. Another example is closed captioning, which is typically in line 21. 1 Press the Trigger More key, then press the TV softkey. 2 Press the Settings softkey, then press the Standard softkey to select the appropriate TV standard (NTSC). 3 Press the Mode softkey and select the TV field of the line you want to trigger on.
Triggering the Oscilloscope 4 To trigger on all sync pulses To quickly find maximum video levels, you could trigger on all sync pulses. When All Lines is selected as the TV trigger mode, the oscilloscope will trigger on all horizontal sync pulses. 1 Press the Trigger More key, then press the TV softkey. 2 Press the Settings softkey, then press the Standard softkey to select the appropriate TV standard. 3 Press the Mode softkey and select All Lines.
4 Triggering the Oscilloscope To trigger on a specific field of the video signal To examine the components of a video signal, trigger on either Field 1 or Field 2 (available for interleaved standards). When a specific field is selected, the oscilloscope triggers on the rising edge of the first serration pulse in the vertical sync interval in the specified field (1 or 2). 1 Press the Trigger More key, then press the TV softkey.
Triggering the Oscilloscope 4 To trigger on all fields of the video signal To quickly and easily view transitions between fields, or to find the amplitude differences between the fields, use the All Fields trigger mode. 1 Press the Trigger More key, then press the TV softkey. 2 Press the Settings softkey, then press the Standard softkey to select the appropriate TV standard. 3 Press the Mode softkey and select All Fields.
4 Triggering the Oscilloscope To trigger on odd or even fields To check the envelope of your video signals, or to measure worst case distortion, trigger on the odd or even fields. When Field 1 is selected, the oscilloscope triggers on color fields 1 or 3. When Field 2 is selected, the oscilloscope triggers on color fields 2 or 4. 1 Press the Trigger More key, then press the TV softkey. 2 Press the Settings softkey, then press the Standard softkey to select the appropriate TV standard.
Triggering the Oscilloscope Figure 19 4 Triggering on Color Field 1 Alternating with Color Field 3 If a more detailed analysis is required, then only one color field should be selected to be the trigger. You can do this by using the TV Holdoff softkey in the trigger More Trigger Menu when the trigger type is set to TV. Press the TV Holdoff softkey and use the Entry knob to adjust the holdoff in half-field increments until the oscilloscope triggers on only one phase of the color burst.
4 Triggering the Oscilloscope Table 14 Standard Time NTSC 8.35 ms PAL 10 ms PAL-M 10 ms SECAM 10 ms Generic 8.35 ms EDTV 480p/60 8.35 ms HDTV 720p/60 8.35 ms HDTV 1080p/24 20.835 ms HDTV 1080p/25 20 ms HDTV 1080i/50 10 ms HDTV 1080i/60 8.
Triggering the Oscilloscope 4 To use UART/RS232 triggering NOTE For UART/RS232 decode setup see page 300. To trigger on a UART (Universal Asynchronous Receiver/Transmitter) signal connect the oscilloscope to the Rx and Tx lines and set up a trigger condition. RS232 (Recommended Standard 232) is one example of a UART protocol. 1 Press the More key in the Trigger section of the front panel.
4 Triggering the Oscilloscope 3 Press the Signals softkey to display the UART/RS232 signals menu. Rx channel Return to previous menu Tx channel 4 Connect an oscilloscope channel to the Rx signal in the circuit under test (the target system), then press the Rx softkey and rotate the Entry knob to select the channel. As you press the Rx softkey (or rotate the Entry knob on mixed-signal oscilloscopes), the channel you select is shown in the upper-right corner of the display next to “URT”.
Triggering the Oscilloscope 4 8 Press the Bus Config softkey and set the following parameters. a #Bits: Set the number of bits in the UART/RS232 words to match your target system (selectable from 5-9 bits). b Parity: Choose odd, even, or none, based on your target system. c Baud: Select the baud rate to match the signal in your target system. d Polarity: Select idle low or idle high to match your target system’s state when at idle. For RS232 select idle low.
4 Triggering the Oscilloscope • Rx X:Data: For use when the target system data words are 9 bits in length including the alert bit (the 9th bit). Triggers on a data byte that you specify regardless of the value of the 9th (alert) bit. The specified data byte applies to the least significant 8 bits (excludes the 9th (alert) bit). • Similar choices are available for Tx. • Rx or Tx Parity Error: Triggers on a parity error based on the parity you have set in the Bus Configuration Menu.
Triggering the Oscilloscope 4 15 Remember to set the trigger mode to Normal (press Mode/Coupling→Mode→Normal) to prevent Auto Triggering.
4 Triggering the Oscilloscope To use USB triggering USB trigger will trigger on a Start of Packet (SOP), End of Packet (EOP) signal, Reset Complete (RC), Enter Suspend (Suspend), or Exit Suspend (Exit Sus) on the differential USB data lines (D+ and D-). USB Low Speed and Full Speed are supported by this trigger.
Triggering the Oscilloscope 4 As you press the D+ or D– softkey (or rotate the Entry knob on mixed-signal oscilloscopes), the D+ and D– label for the source channel is automatically set and the channel you select is shown in the upper-right corner of the display next to “USB”. Adjust the trigger level for the selected analog channel by turning the Trigger Level knob. Press the D15 Thru D0 key and select Thresholds to set the threshold level for digital channels.
4 Triggering the Oscilloscope The Trigger Out connector You can select one of the following signals to be output at the TRIG OUT connector on the rear panel of the oscilloscope: • Triggers • Source frequency • Source frequency/8 (except 100 MHz BW models) Triggers This is the default selection. In this mode, a rising edge is output each time the oscilloscope triggers. This rising edge is delayed 17 ns from the oscilloscope’s trigger point. The output level is 0-5 V into an open circuit, and 0-2.
Agilent 6000 Series Oscilloscope User’s Guide 5 Making Measurements To use the XY horizontal mode 208 Math Functions 213 Cursor Measurements 232 Automatic Measurements 239 Post Acquisition Processing In addition to changing display parameters after the acquisition, you can perform all of the measurements and math functions after the acquisition. Measurements and math functions will be recalculated as you pan and zoom and turn channels on and off.
5 Making Measurements To use the XY horizontal mode The XY horizontal mode converts the oscilloscope from a volts-versus-time display to a volts-versus-volts display using two input channels. Channel 1 is the X-axis input, channel 2 is the Y-axis input. You can use various transducers so the display could show strain versus displacement, flow versus pressure, volts versus current, or voltage versus frequency.
Making Measurements 5 Signal must be centered in “X” D A B C Figure 21 Example of centering a signal on the display Figure 22 Signal centered on the display 4 Press the Cursors key. 5 Set the Y2 cursor to the top of the signal, and set Y1 to the bottom of the signal.
5 Making Measurements Note the ∆Y value at the bottom of the display. In this example, we are using the Y cursors, but you could have used the X cursors instead. Figure 23 Cursors set on displayed signal 6 Move the Y1 and Y2 cursors to the intersection of the signal and the Y axis. Again, note the ∆Y value.
Making Measurements Figure 24 5 Cursors set to center of signal 7 Calculate the phase difference using the formula below. second ∆Y 1.031 sin θ = -------------------------- = ------------- ; θ = 37.65 degrees of phase shift first ∆Y 1.688 Z-Axis Input in XY Display Mode (Blanking) When you select the XY display mode, the time base is turned off. Channel 1 is the X-axis input, channel 2 is the Y-axis input, and channel 4 (or the External trigger on 2-channel models) is the Z-axis input.
5 212 Making Measurements Figure 25 Signals are 90 out of phase Figure 26 Signals are in phase 6000 Series Oscilloscope User’s Guide
Making Measurements 5 Math Functions The Math menu lets you display math functions on analog channels. You can: • subtract (–) or multiply (*) the signals acquired on analog channels 1 and 2, then display the result. • integrate, differentiate, perform an FFT, or the square root function on the signal acquired on any analog channel or on math functions 1 * 2, 1 – 2, or 1 + 2, then display the result. To access math functions: 1 Press the Math key on the front panel to display the Waveform Math Menu.
5 Making Measurements Math scale and offset Any math function may be manually scaled by pressing the Scale or Offset softkeys and then adjusting the value. Math Scale and Offset are Set Automatically Any time the currently displayed math function definition is changed, the function is automatically scaled for optimum vertical scale and offset.
Making Measurements 5 Multiply When you select 1 * 2, channel 1 and channel 2 voltage values are multiplied point by point, and the result is displayed. 1 * 2 is useful for seeing power relationships when one of the channels is proportional to the current. 1 Press the Math key, press the 1 * 2 softkey, then press the Scale or Offset sofkeys if you want to change the scaling or offset for the multiply function.
5 Making Measurements The figure below shows an example of multiply.
Making Measurements 5 Subtract When you select 1 – 2, channel 2 voltage values are subtracted from channel 1 voltage values point by point, and the result is displayed. You can use 1 – 2 to make a differential measurement or to compare two waveforms. You may need to use a true differential probe if your waveforms have DC offsets larger than the dynamic range of the oscilloscope's input channel.
5 Making Measurements The figure below shows an example of subtract.
Making Measurements 5 Differentiate d/dt (differentiate) calculates the discrete time derivative of the selected source. You can use differentiate to measure the instantaneous slope of a waveform. For example, the slew rate of an operational amplifier may be measured using the differentiate function. Because differentiation is very sensitive to noise, it is helpful to set acquisition mode to Averaging in the Acquire menu.
5 Making Measurements • Offset —lets you set your own offset for the dV/dt math function. The offset value is in units/second where units can be V (Volts), A (Amps), or W (Watts) and is represented by the center horizontal grid line of the display. Press the Offset softkey, then turn the Entry knob to change the offset for d/dt.
Making Measurements 5 Integrate ∫ dt (integrate) calculates the integral of the selected source. You can use integrate to calculate the energy of a pulse in volt-seconds or measure the area under a waveform. ∫ dt plots the integral of the source using the “Trapezoidal Rule”.
5 Making Measurements Channel 1 0V ∫ dt waveform Channel 1 0V ∫ dt waveform Source select Figure 30 222 ∫ dt Scale ∫ dt Offset Integrate and Signal Offset 6000 Series Oscilloscope User’s Guide
Making Measurements 5 FFT Measurement FFT is used to compute the fast Fourier transform using analog input channels or math functions 1 + 2, 1 – 2, or 1 * 2. FFT takes the digitized time record of the specified source and transforms it to the frequency domain. When the FFT function is selected, the FFT spectrum is plotted on the oscilloscope display as magnitude in dBV versus frequency.
5 Making Measurements vertical bandwidth when making FFT measurements. The FFT sample rate is displayed directly above the softkeys when the FFT menu is displayed. Aliasing happens when there are frequency components in the signal higher than half the sample rate. Since the FFT spectrum is limited by this frequency, any higher components are displayed at a lower (aliased) frequency. The following figure illustrates aliasing. This is the spectrum of a 990 Hz square wave, which has many harmonics.
Making Measurements 5 Spectral Leakage The FFT operation assumes that the time record repeats. Unless there is an integral number of cycles of the sampled waveform in the record, a discontinuity is created at the end of the record. This is referred to as leakage. In order to minimize spectral leakage, windows that approach zero smoothly at the beginning and end of the signal are employed as filters to the FFT. The FFT menu provides three windows: Hanning, flattop, and rectangular.
5 Making Measurements • Center — sets the FFT spectrum frequency represented at the center vertical grid line of the display. It is possible to set the Center to values below half the span or above the maximum available frequency, in which case the displayed spectrum will not take up the whole screen. Press the Center softkey, then turn the Entry knob to set the desired center frequency of the display.
Making Measurements 5 • Scale — lets you set your own vertical scale factors for FFT expressed in dB/div (decibels/division). Press the Scale softkey, then turn the Entry knob to rescale your math function. • Offset — lets you set your own offset for the FFT. The offset value is in dB and is represented by the center horizontal grid line of the display. Press the Offset softkey, then turn the Entry knob to change the offset of your math function.
5 Making Measurements Figure 32 FFT measurements FFT Measurement Hints The number of points acquired for the FFT record is 1000 and when frequency span is at maximum, all points are displayed. Once the FFT spectrum is displayed, the frequency span and center frequency controls are used much like the controls of a spectrum analyzer to examine the frequency of interest in greater detail.
Making Measurements 5 resolve two closely space frequencies. A good way to test the ability of the FFT to resolve two closely spaced frequencies is to examine the sidebands of an amplitude modulated sine wave. For the best vertical accuracy on peak measurements: • Make sure the probe attenuation is set correctly. The probe attenuation is set from the Channel menu if the operand is a channel. • Set the source sensitivity so that the input signal is near full screen, but not clipped.
5 Making Measurements Square Root √ (square root) calculates the square root of the selected source. In Zoom mode, the √ (square root) function does not display in the zoomed portion of the display. 1 Press the Math key, press the √ (square root) softkey, then press the Source, Scale, or Offset sofkeys if you want to change the source, scaling, or offset for the square root function. • Source — selects the source for √ (square root).
Making Measurements 5 The figure below shows an example of √ (square root).
5 Making Measurements Cursor Measurements You can measure waveform data using cursors. Cursors are horizontal and vertical markers that indicate X-axis values (usually time) and Y-axis values (usually voltage) on a selected waveform source. The position of the cursors can be moved by turning the Entry knob. When you press the Cursors key, it will illuminate and the cursors will turn on. To turn cursors off, press this key again until it is not illuminated, or press the Quick Meas key.
Making Measurements 5 • Binary — Binary logic levels are displayed directly above the softkeys for the current X1 and X2 cursor positions for all displayed channels. Cursor X1 values for analog channels 1 through 4 Cursor X1 values for digital channels D15 Through D0 • Hex — Hexadecimal logic levels are displayed directly above the softkeys for the current X1 and X2 cursor positions for all displayed channels.
5 Making Measurements 4 Select the X and Y softkeys to make a measurement. • X Y — Press this softkey to select either X cursors or Y cursors for adjustment. The cursor currently assigned to the Entry knob displays brighter than the other cursors. X cursors are vertical dashed lines that adjust horizontally and normally indicate time relative to the trigger point. When used with the FFT math function as a source, the X cursors indicate frequency.
Making Measurements 5 Turn the Entry knob to adjust the Y1 or Y2 cursor when its softkey is selected. • X1 X2 — Press this softkey to adjust the X1 and X2 cursors together by turning the Entry knob. The ∆X value will remain the same since the cursors adjust together. You can adjust the X cursors together to check for pulse width variations in a pulse train. • Y1 Y2 — Press this softkey to adjust the Y1 and Y2 cursors together by turning the Entry knob.
5 Making Measurements Cursor Examples 236 Figure 34 Cursors measure pulse widths other than middle threshold points Figure 35 Cursors measure frequency of pulse ringing 6000 Series Oscilloscope User’s Guide
Making Measurements 5 Expand the display with zoom sweep, then characterize the event of interest with the cursors. Figure 36 Cursors track zoom sweep Put the X1 cursor on one side of a pulse and the X2 cursor on the other side of the pulse.
5 Making Measurements Press the X1 X2 softkey and move the cursors together to check for pulse width variations in a pulse train.
Making Measurements 5 Automatic Measurements The following automatic measurements can be made in the Quick Meas menu.
5 Making Measurements Preshoot and Overshoot • Preshoot* • Overshoot* * Measurement on analog channels only. To make an automatic measurement A brief description of how to make automatic measurements is given on page 96. Quick Meas makes automatic measurements on any channel source or any running math function. The results of the last four measurements selected are displayed on the dedicated line above the softkeys, or in the display area when some menus are selected.
Making Measurements 5 If a portion of the waveform required for a measurement is not displayed or does not display enough resolution to make the measurement, the result will display “No Edges”, “Clipped”, “Low Signal”, “< value”, or “> value”, or a similar message to indicate that the measurement may not be reliable. 3 Press the Clear Meas softkey to stop making measurements and to erase the measurement results from the display line above the softkeys.
5 Making Measurements thresholds. Each analog channel and the math waveform can be assigned unique threshold values. Source select Threshold Type Lower Threshold Middle Threshold Upper Threshold Return to previous menu 3 Press the Type softkey to set the measurement threshold to % (percentage of Top and Base value) or to Absolute (absolute value.) • Percentage thresholds can be set from 5% to 95%. • The units for absolute threshold for each channel is set in the channel probe menu.
Making Measurements 5 • If threshold Type is set to %, the middle threshold value can be set from 6% to 94%. 6 Press the Upper softkey, then turn the Entry knob to set the upper measurement threshold value. Decreasing the upper value below the set middle value will automatically decrease the middle value to be less than the upper value. The default upper threshold is 90% or 1.50 V. • If threshold Type is set to %, the upper threshold value can be set from 7% to 95%.
5 Making Measurements Counter The 6000 Series oscilloscopes have an integrated hardware frequency counter which counts the number of cycles that occur within a period of time (known as the gate time) to measure the frequency of a signal. The gate time for the Counter measurement is automatically adjusted to be 100 ms or twice the current time window, whichever is longer, up to 1 second. The Counter can measure frequencies up to the bandwidth of the oscilloscope.
Making Measurements 5 through the lower and upper threshold levels which eliminates runt pulses. The X cursors show what portion of the waveform is being measured. The Y cursor shows the middle threshold point. To isolate an event for frequency measurement The following figure shows how to use zoom sweep to isolate an event for a frequency measurement. If the measurement is not possible in the zoom mode, then the main time base is used.
5 Making Measurements Fall Time The fall time of a signal is the time difference between the crossing of the upper threshold and the crossing of the lower threshold for a negative-going edge. The X cursor shows the edge being measured. For maximum measurement accuracy, set the sweep speed as fast as possible while leaving the complete falling edge of the waveform on the display. The Y cursors show the lower and upper threshold points.
Making Measurements 5 To measure the peak of an FFT: 1 Select FFT as the math function in the Math menu. 2 Choose Math as the source in the Quick Meas menu. 3 Choose Maximum and X at Max measurements. Maximum units are in dB and X at Max units are in Hertz for FFT. X at Min X at Min is the X axis value (usually time) at the first displayed occurrence of the waveform Minimum, starting from the left-side of the display. For periodic signals, the position of the minimum may vary throughout the waveform.
5 Making Measurements 1 Press the Quick Meas&Select and select Delay. Press the Settings softkey to select the source channels and slope for the delay measurement. The default Delay settings measure from the rising edge of channel 1 to the rising edge of channel 2. 2 Press the Measure Delay softkey to make the measurement. The following example shows a delay measurement between the rising edge of channel 1 and the rising edge of channel 2.
Making Measurements 5 Period Source 1 Delay Source 2 1 Press the Settings softkey to select the source 1 and source 2 channels for the phase measurement. The default Phase settings measure from channel 1 to channel 2. The example below shows a phase measurement between the channel 1 and the math d/dt function on channel 1. Figure 40 Phase Measurement Voltage Measurements Measurement units for each input channel can be set to Volts or Amps using the channel Probe Units softkey.
5 Making Measurements and ∫ dt when 1-2 or 1+2 is the selected source if channel 1 and channel 2 are set to dissimilar units in the channel Probe Units softkey. Math Measurements and Units Only Peak-Peak, Maximum, Minimum, Average, X at Min, and X at Max automatic measurements may be made on a math FFT function. See “Making time measurements automatically” for the FFT X at Max and X at Min measurement. Use the cursors to make other measurements on FFT.
Making Measurements 5 Amplitude The Amplitude of a waveform is the difference between its Top and Base values. The Y cursors show the values being measured. Average Average is the sum of the waveform samples divided by the number of samples over one or more full periods. If less than one period is displayed, Average is calculated on the full width of the display. The X cursors show what portion of the displayed waveform is being measured.
5 Making Measurements RMS RMS (DC) is the root-mean-square value of the waveform over one or more full periods. If less than one period is displayed, RMS (DC) average is calculated on the full width of the display. The X cursors show what interval of the waveform is being measured.
Making Measurements 5 mean -3s -2s -1s 0 1s 2s 3s 68.3% 95.4% 99.7% The mean is calculated as follows: N ∑ xi =1 x = i------------N where: x = the mean. N = the number of measurements taken. xi = the ith measurement result. The standard deviation is calculated as follows: N ∑ ( xi – x ) σ = 2 i=1 ----------------------------N–1 where: σ = the standard deviation. N = the number of measurements taken. xi = the ith measurement result. x = the mean.
5 Making Measurements Top The Top of a waveform is the mode (most common value) of the upper part of the waveform, or if the mode is not well defined, the top is the same as Maximum. The Y cursor shows the value being measured. To isolate a pulse for Top measurement The following figure shows how to use zoom sweep to isolate a pulse for a Top measurement.
Making Measurements 5 Overshoot and Preshoot Measurements Digital channel time measurements Automatic measurements Preshoot and Overshoot are not valid measurements for the math FFT function or for digital channels on the mixed-signal oscilloscope. Preshoot Preshoot is distortion that precedes a major edge transition expressed as a percentage of Amplitude. The X cursors show which edge is being measured (edge closest to the trigger reference point).
5 Making Measurements Overshoot Overshoot is distortion that follows a major edge transition expressed as a percentage of Amplitude. The X cursors show which edge is being measured (edge closest to the trigger reference point).
Agilent 6000 Series Oscilloscope User’s Guide 6 Displaying Data Pan and Zoom 258 Antialiasing 260 Using the XGA video output 260 Display Settings 261 Varying the intensity to view signal detail 263 Acquisition Modes 265 Using Serial Decode 271 To decode I2C data 272 To decode SPI data 276 To decode CAN data 281 To decode LIN data 288 To decode FlexRay data 294 To decode UART/RS232 data 300 To reduce the random noise on a signal 307 To capture glitches or narrow pulses with peak detect and infinite persiste
6 Displaying Data Pan and Zoom The ability to pan (move horizontally) and zoom (expand or compress horizontally) an acquired waveform is important because of the additional insight it can reveal about the captured waveform. This additional insight is often gained from seeing the waveform at different levels of abstraction. You may want to view both the big picture and the specific little picture details.
Displaying Data 6 To pan and zoom a waveform 1 Press the Run/Stop key to stop acquisitions. The Run/Stop key is illuminated red when the oscilloscope is stopped. 2 Turn the sweep speed knob to zoom horizontally and turn the volts/division knob to zoom vertically. The ∇ symbol at the top of the display indicates the time reference point where the zoom-in/zoom-out is referenced. 3 Turn the Horizontal Position knob ( ) to pan horizontally and turn the channel’s vertical position knob ( ) to pan vertically.
6 Displaying Data Antialiasing At slower sweep speeds, the sample rate is reduced and a proprietary display algorithm is used to minimize the likelihood of aliasing. By default, Antialiasing is enabled. You should leave Antialiasing enabled unless there is a specific reason to switch it off. If you need to switch Antialiasing off, press Utilities&Options&Preferences and press the Antialiasing softkey to switch the feature off. The displayed waveforms will be more susceptible to aliasing.
Displaying Data 6 Display Settings • Press the Display key to view the Display menu. To manually control Display settings on 6000L models start the Remote Front Panel (see page 44) and select Waveform from the Main Menu or press ctrl+W to access the oscilloscope’s Display Menu. Infinite persistence With infinite persistence, the oscilloscope updates the display with new acquisitions, but does not erase the results of previous acquisitions.
6 Displaying Data Accumulating multiple acquisitions Turning off infinite persistence does not clear the display. This allows you to accumulate multiple acquisitions, stop acquisitions, and then compare future acquisitions to the stored waveforms. Clearing stored infinite persistence waveforms In addition to clearing the display by pressing the Clear Display softkey, the display is also cleared of previous acquisitions if you press the AutoScale key.
Displaying Data 6 Using Vectors (Display menu) One of the most fundamental choices you must make about your display is whether to draw vectors (connect the dots) between the samples, or simply let the samples fill in the waveform. To some degree, this is a matter of personal preference, but it also depends on the waveform. • You will probably operate the oscilloscope most often with vectors on. Complex analog signals like video and modulated signals show analog-like intensity information with vectors on.
6 264 Displaying Data Figure 43 Amplitude Modulation with Noise Shown at 100% Intensity Figure 44 Amplitude Modulation with Noise Shown at 40% Intensity 6000 Series Oscilloscope User’s Guide
Displaying Data 6 Acquisition Modes The 6000 Series oscilloscopes have the following acquisition modes: • Normal — for most waveforms (with normal decimating at slower sweep speeds, no averaging). • Peak Detect — for displaying narrow pulses that occur infrequently (at slower sweep speeds). • Averaging — for reducing noise and increasing resolution (at all sweep speeds, without bandwidth or rise time degradation). • High Resolution — for reducing random noise (at slower sweep speeds).
6 Displaying Data Normal Mode In Normal mode at slower sweep speeds, extra samples are decimated (in other words, some are thrown away). This mode yields the best display for most waveforms. Peak Detect Mode In Peak Detect mode at slower sweep speeds, minimum and maximum samples are kept in order to capture infrequent and narrow events (at the expense of exaggerating any noise). This mode displays all pulses that are at least as wide as the sample period (see Table 16).
Displaying Data 6 High Resolution mode is equivalent to the Averaging mode with #Averages=1; however, you can turn on Realtime sampling in the High Resolution mode. High Resolution mode can be used on both single-shot and repetitive signals and it does not slow waveform update because the computation is done in the MegaZoom custom ASIC. High Resolution mode limits the scope's real-time bandwidth because it effectively acts like a low-pass filter.
6 Displaying Data To use the Averaging mode 1 Press the Acquire key, then press the Acq Mode softkey until the Averaging mode is selected. 2 Press the #Avgs softkey and turn the Entry knob to set the number of averages that best eliminates the noise from the displayed waveform. The number of acquisitions being averaged is displayed in the # Avgs softkey.
Displaying Data Figure 46 6 128 Averages used to reduce random noise Realtime Sampling Option Realtime sampling specifies that the oscilloscope produce the waveform display from samples collected during one trigger event (that is, one acquisition). Use Realtime sampling to capture infrequent triggers, unstable triggers, or complex changing waveforms, such as eye diagrams. Realtime sampling can be turned on in Normal, Peak Detect, or High Resolution acquisition modes.
6 Displaying Data • The oscilloscope produces the waveform display from samples collected from multiple acquisitions. In this case, the reconstruction filter is not used. Realtime Sampling and Oscilloscope Bandwidth To accurately reproduce a sampled waveform, the sample rate should be at least four times the highest frequency component of the waveform. If not, it is possible for the reconstructed waveform to be distorted or aliased. Aliasing is most commonly seen as jitter on fast edges.
Displaying Data 6 Using Serial Decode Agilent’s hardware accelerated serial decode options can be licensed on 4-channel or 4+16-channel 6000 Series oscilloscopes. Three serial decode licenses are available: • The N5423A (Option LSS) license provides the ability to decode I2C (Inter-IC) and SPI (Serial Peripheral Interface) serial busses. • The N5424A (Option AMS) license provides the ability to decode CAN (Controller Area Network) and LIN (Local Interconnect Network) serial busses.
6 Displaying Data To decode I2C data NOTE NOTE Because of oscilloscope hardware resource limitations, you cannot decode I2C data while LIN triggering is selected. For I2C triggering setup see page 164. To manually control Serial Decode on 6000L models start the Remote Front Panel (see page 44) and select Waveform from the Main Menu or press ctrl+A to access the oscilloscope’s Acquire Menu. 1 Select the I2C serial decode mode: a Press the Acquire key. b Press the Serial Decode softkey.
Displaying Data 6 2 Specify the I2C signals: NOTE If you have already set up an I2C trigger, the signals have already been specified, and you can continue on with step 4. Changing I2C signals in the Serial Decode setup also changes them in the Trigger setup. a Press the Settings softkey to access the I2C Signals Menu. I2C data channel I2C clock channel Return to previous menu b Press the SCL softkey, and use the Entry knob to select the channel probing the clock signal.
6 Displaying Data NOTE If the setup does not produce a stable trigger, the I2C signal may be slow enough that the oscilloscope is AutoTriggering. Press the Mode/Coupling key, then press the Mode softkey to set the trigger mode from Auto to Normal. You can use the Zoom horizontal sweep mode for easier navigation of the acquired data.
Displaying Data 6 • White lines show an idle bus. • Blue rectangles show an active bus (inside a packet/frame). • In the decoded hexadecimal data: • Address values appear at the start of a frame. • Write addresses appear in light-blue along with the “W” character. • Read addresses appear in yellow along with the “R” character. • Restart addresses appear in green along with the “S” character. • Data values appear in white and may extend beyond the frame if an idle period follows.
6 Displaying Data To decode SPI data NOTE Because of oscilloscope hardware resource limitations, you cannot decode SPI data while CAN or LIN triggering is selected. NOTE For SPI triggering setup see page 182. 1 Select the SPI serial decode mode: a Press the Acquire key. b Press the Serial Decode softkey. Display decode Decode mode Signal setup menu SPI word size Return to previous menu c In the Serial Decode Menu, press the Mode softkey.
Displaying Data 6 2 Specify the SPI signals: If you have already set up an SPI trigger, the signals and their trigger or threshold levels have already been specified, and you can continue on with step 4. NOTE Changing SPI signals in the Serial Decode setup also changes them in the Trigger setup. a Press the Settings softkey to access the SPI Signals Menu.
6 Displaying Data b Press the Clock softkey, and use the Entry knob to select the channel probing the clock signal. c Press the rising or falling edge softkey to specify the edge that the clock occurs on. d Press the Data softkey, and use the Entry knob to select the channel probing the data signal. e Repeatedly press and release the Frame by softkey to select the method used to identify frames: • ~CS - Not Chip Select — an active low chip select signal.
Displaying Data 6 You can use the Zoom horizontal sweep mode for easier navigation of the acquired data. Interpreting Decoded SPI Data • White lines show an idle bus. • Blue rectangles show an active bus (inside a packet/frame). • The number of clocks in a frame appears in light-blue above the frame, to the right. • Decoded hexadecimal data values appear in white and may extend beyond the frame if an idle period follows.
6 Displaying Data • Aliased bus values (undersampled or indeterminate) are drawn in red. • Unknown bus values (undefined or error conditions) are drawn in red.
Displaying Data 6 To decode CAN data NOTE For CAN triggering setup see page 148. 1 Connect the CAN signal to one of the oscilloscope’s input channels. 2 Set up the trigger mode as described in “Triggering the Oscilloscope” on page 127. You can use CAN trigger or another trigger type. 3 Select the CAN serial decode mode: a Press the Acquire key. b Press the Serial Decode softkey. Display decode Decode mode Signal setup menu Return to previous menu c In the Serial Decode Menu, press the Mode softkey.
6 Displaying Data 4 Specify the CAN signal: a Press the Settings softkey to access the CAN Signals Menu. Currently selected channel Signal Source Baud rate Sample Point Trigger level Return to previous menu 5 Press the Source softkey, and use the Entry knob to select the channel for the CAN signal. Make sure the trigger or threshold levels are set to the middle of the CAN signal. 6 Repeatedly press and release the Baud softkey to specify the CAN signal baud rate.
Displaying Data 6 bus is measured. This controls the point within the bit’s time where the bit value is captured. One Bit Sample Point 60% 70% 80% 8 Set the trigger level. • For analog channels, turn the Trigger Level knob. • For digital channels, press the D15 Thru D0 key and the Thresholds softkey to access the threshold level setting softkeys. NOTE Changing the Source settings in the Serial Decode setup also changes them in the Trigger setup.
6 Displaying Data Interpreting Decoded CAN Data • Frame ID appears in hex digits in yellow. Frames of 11 or 29 bits are automatically detected. • Remote frame (RMT) appears in green. • Data length code (DLC) appears in blue. • Data bytes appear in hex digits in white for data frames. • Cyclic redundancy check (CRC) appears in hex digits in blue when valid, or in red to indicate that the oscilloscope’s hardware decode calculated a CRC that is different from the incoming CRC data stream.
Displaying Data 6 • Red dots in the decode line indicate that there is data that is not being displayed. Scroll or expand the horizontal scale to view the information. • Aliased bus values (undersampled or indeterminate) are drawn in red. • Unknown bus values (undefined or error conditions) are drawn in red with a “?” label. • Flagged error frames are drawn in red with an “ERR” label.
6 Displaying Data CAN Totalizer The CAN totalizer provides a direct measure of bus quality and efficiency. The CAN totalizer measures total CAN frames, flagged error frames, overload frames, and bus utilization. The totalizer is always running (counting frames and calculating percentages) and is displayed whenever CAN decode is displayed. The totalizer counts even when the oscilloscope is stopped (not acquiring data). Pressing the Run/Stop key does not affect the totalizer.
Displaying Data Total Frame Count 6000 Series Oscilloscope User’s Guide Overload Frame Count and Percent Error Frame Count and Percent 6 Bus Utilization Percentage 287
6 Displaying Data To decode LIN data NOTE For LIN triggering setup see page 172. 1 Select the LIN serial decode mode: a Press the Acquire key. b Press the Serial Decode softkey. Display decode Decode mode Signal setup menu Show parity bits Return to previous menu c In the Serial Decode Menu, press the Mode softkey. d Use the Entry knob (or repeatedly press and release the Mode softkey) to select the LIN serial decode mode. 2 Choose whether to include the parity bits in the identifier field.
Displaying Data 6 3 Specify the LIN signal: a Press the Settings softkey to access the LIN Signals Menu.
6 Displaying Data b Press the Source softkey, and use the Entry knob to select the channel probing the LIN signal. c Repeatedly press and release the Baud softkey to specify the LIN signal baud rate. d Repeatedly press and release the Smpl Pt softkey to select the sample point. This controls the point within the bit’s time where the bit value is captured. One Bit Sample Point 60% 70% 80% e Repeatedly press and release the Standard softkey to select the LIN standard (LIN 1.3 or LIN 2.
Displaying Data NOTE 6 Changing the Trigger settings in the Serial Decode setup also changes them in the Trigger setup. g If the decode line does not appear on the display, press the up-arrow softkey to return to the previous menu, then press the Decode softkey. 5 If the oscilloscope is stopped, press the Run/Stop key to acquire and decode data. NOTE If the setup does not produce a stable trigger, the LIN signal may be slow enough that the oscilloscope is AutoTriggering.
6 Displaying Data Interpreting Decoded LIN Data 292 6000 Series Oscilloscope User’s Guide
Displaying Data 6 • White traces show an idle bus (LIN 1.3 only). • Blue bi-level trace shows an active bus (inside a packet/frame). • The hexadecimal ID and parity bits (if enabled) appear in yellow. If a parity error is detected the hexadecimal ID and parity bits (if enabled) appear in red. • Decoded hexadecimal data values appear in white and may extend beyond the frame if an idle period follows. • For LIN 1.3, the checksum appears in blue if correct, or red if incorrect.
6 Displaying Data To decode FlexRay data To decode FlexRay data, you need a four-channel 6000 Series mixed signal oscilloscope, the N5432A FlexRay triggering and decode option, the Agilent VPT1000 protocol analyzer, and its MSO communications cable. 1 Set up the oscilloscope and the VPT1000. See “Setting Up the Oscilloscope and the VPT1000” on page 156. 2 Set up the trigger mode as described in “Triggering the Oscilloscope” on page 127.
Displaying Data 6 When the FlexRay mode is selected, you can use the Settings softkey to access the VPT1000 Menu for changing the VPT1000 control/operating modes. NOTE Changing the VPT1000 settings in the Serial Decode Menu also changes them in the FlexRay Trigger Menu. 4 If the decode line does not appear on the display, press the Decode softkey to turn it on. The VPT1000 must be connected and running in asynchronous or synchronous mode for a meaningful display.
6 Displaying Data Interpreting Decoded FlexRay Frame Data Trailer CRC Payload data Header CRC (blue) Payload Length (green) Frame ID (yellow) Frame Type (blue) The FlexRay decode display shows frame decoding (bottom row) and if the VPT1000 is in the synchronous monitoring mode, global time-schedule decoding (top row). Frame Decoding • • • • • • • • 296 (bottom row of decode display) Frame type (NORM, SYNC, SUP, NULL in blue). Frame ID (decimal digits in yellow).
Displaying Data 6 Interpreting Decoded FlexRay Time Data Time-Schedule Decode: Slot number (dynamic - green) Dynamic segment (green) Slot number (static - orange) Static segment (orange) Scheduled cycle number (yellow) Global Time-Schedule Decoding (top row of decode display) • Segment type: static = SS in orange, dynamic = DS in green, Symbol in yellow, Idle = NIT (network idle time) in white. • Segment number: decimal digits in orange (static) or green (dynamic).
6 Displaying Data FlexRay Totalizer The FlexRay totalizer consists of counters that provide a direct measure of bus quality and efficiency. The totalizer is running, counting frames and calculating percentages, even when the oscilloscope is stopped (not acquiring data). The totalizer appears on screen whenever FlexRay Decode is ON in the Serial Decode Menu. When an overflow condition occurs, the counter displays OVERFLOW. The counters can be reset to zero by pressing the Reset FlexRay Counters softkey.
Displaying Data 6 Counters Total Frame Count Null Frame Count and Percent Sync Frame Count and Percent • The FRAMES counter gives a real-time count of all received frames. • The NULL counter gives the number and percentage of null frames. • The SYNC counter gives the number and percentage of sync frames.
6 Displaying Data To decode UART/RS232 data NOTE Because of oscilloscope hardware resource limitations, you cannot decode UART/RS232 data while CAN, LIN, or FlexRay triggering is selected. NOTE For UART/RS232 triggering setup see page 199. 1 Select the UART/RS232 serial decode mode: a Press the Acquire key. b Press the Serial Decode softkey. Display decode Decode mode Signal setup menu Frame counter reset Return to previous menu c In the Serial Decode Menu, press the Mode softkey.
Displaying Data NOTE 6 Changing UART/RS232 signals in the Serial Decode setup also changes them in the Trigger setup. 2 Specify the UART/RS232 signals: a Press the Settings softkey to access the UART/RS232 decode settings menu.
6 Displaying Data See the UART/RS232 triggering section on page page 199 for detailed instructions. 3 Press the Return to previous menu (up arrow) softkey. NOTE Changing the Bus Configuration settings in the Serial Decode setup also changes them in the Trigger setup. 4 Press the Bus Config softkey. a #Bits: Set the number of bits in the UART/RS232 words to match your target system (selectable from 5-9 bits). b Parity: Choose odd, even, or none, based on your target system.
Displaying Data 6 7 Optional: Press the Framing softkey and select a value. In the decode display the chosen value will be displayed in light blue. However, if a parity error occurs the data will be displayed in red. 8 Make sure the trigger or threshold levels are set to the middle of the signals: • For analog channels, turn the Trigger Level knob. • For digital channels, press the D15-D0 key and the Thresholds softkey to access the threshold level setting softkeys.
6 Displaying Data Interpreting Decoded UART/RS232 Data • An idle bus is shown in white. • An active bus is shown in dark blue, with vertical lines designating the start and end of each data word. • When using 5-8 bit formats, the decoded data is displayed in white (in binary, hex, or ASCII). • When using the 9 bit format, all data words are displayed in green, including the 9th bit. The 9th bit is displayed on the left. • When a data word value is selected for framing, it is displayed in light blue.
Displaying Data 6 • An unknown (undefined) bus is shown in red. • A parity error will cause the associated data word to be shown in red, which includes the 5-8 data bits and the optional 9th bit.
6 Displaying Data UART/RS232 Totalizer The UART/RS232 totalizer consists of counters that provide a direct measure of bus quality and efficiency. The totalizer appears on screen whenever UART/RS232 Decode is ON in the Serial Decode Menu. The totalizer is running, counting frames and calculating the percentage of error frames, even when the oscilloscope is stopped (not acquiring data). The ERR (error) counter is a count of Rx and Tx frames with parity errors.
Displaying Data 6 To reduce the random noise on a signal If the signal you are probing is noisy, you can set up the oscilloscope to reduce the noise on the displayed waveform. First, you stabilize the displayed waveform by removing the noise from the trigger path. Second, you reduce the noise on the displayed waveform. 1 Connect a signal to the oscilloscope and obtain a stable display.
6 Displaying Data LF Reject Low-frequency reject (LF reject) adds a high-pass filter with the 3-dB point at 50 kHz. LF reject removes low-frequency signals, such as power line noise, from the trigger path. • Press Mode/Coupling&Coupling&LF Reject. 0 dB 3 dB down point Pass Band DC 50 kHz Noise rejection Noise reject increases the trigger hysteresis band. By increasing the trigger hysteresis band, you reduce the possibility of triggering on noise.
Displaying Data 6 To capture glitches or narrow pulses with peak detect and infinite persistence A glitch is a rapid change in the waveform that is usually narrow as compared to the waveform. Peak detect mode can be used to more easily view glitches or narrow pulses. In peak detect mode, narrow glitches and sharp edges are displayed more brightly than when in Normal acquire mode, making them easier to see.
6 Displaying Data Figure 48 15 ns Narrow Pulse, 20 ms/div, Peak Detect Mode Using peak detect mode to find a glitch 1 Connect a signal to the oscilloscope and obtain a stable display. 2 To find the glitch, press the Acquire key, then, press the Acq Mode softkey until Peak Detect is selected. 3 Press the Display key then press the ∞ Persist (infinite persistence) softkey. Infinite persistence updates the display with new acquisitions but does not erase previous acquisitions.
Displaying Data 6 4 Characterize the glitch with zoom sweep: a Press the Menu/Zoom key, then press the Zoom softkey. b To obtain a better resolution of the glitch, expand the time base. c Use the horizontal position knob ( ) to pan through the waveform to set the expanded portion of the main sweep around the glitch.
6 Displaying Data How AutoScale Works AutoScale automatically configures the oscilloscope to best display the input signals by analyzing any waveforms present at each channel and at the external trigger input. This includes the digital channels on MSO models. AutoScale finds, turns on, and scales any channel with a repetitive waveform that has a frequency of at least 50 Hz, a duty cycle greater than 0.5%, and an amplitude of at least 10 mV peak-to-peak.
Displaying Data 6 Specifying the Channels Displayed After AutoScale The Channels softkey selection determines which channels will be displayed on subsequent AutoScales. • All Channels — The next time you press AutoScale, all channels that meet the requirements of AutoScale will be displayed. • Only Displayed Channels — The next time you press AutoScale, only the channels that are turned on will be examined for signal activity.
6 314 Displaying Data 6000 Series Oscilloscope User’s Guide
Agilent 6000 Series Oscilloscope User’s Guide 7 Saving and Printing Data Printing the oscilloscope’s display 316 Supported Printers 318 Saving oscilloscope data 320 Selecting a destination for your saved data 321 Selecting a file name 322 Waveform Trace and Oscilloscope Setup 324 Display Image and Waveform Data File Formats 324 Choosing save settings 325 To save a waveform and/or setup to a USB device 327 To save a waveform and/or setup to the oscilloscope’s internal memory 327 To recall waveform trace and
7 Saving and Printing Data Printing the oscilloscope’s display To print the oscilloscope’s display: 1 Connect a USB printer to either the USB port on the front panel or the rectangular USB host port on the rear panel. A list of supported printers is on page 318. 2 Press the Print key (labeled Quick Print on older models) on the front panel. 3 Press the Press to Print softkey. NOTE The Print function remembers the screen you were on before you pressed the print key.
Saving and Printing Data 7 Selecting print options Press the Options softkey to change the following options: • Factors — Select Factors if you want the oscilloscope scale factors to be included on your printout. Oscilloscope scale factors include vertical, horizontal, trigger, acquisition, math, and display settings. • Invert Graticule Colors — The Invert Graticule Colors option can be used to reduce the amount of black ink it takes to print oscilloscope images by changing the black background to white.
7 Saving and Printing Data Supported Printers The following HP printers, available in stores at the time this manual was written, have been tested and found to be compatible with the InfiniiVision 6000 Series oscilloscopes. Visit www.agilent.com/find/mso6000 and select Technical Support, then FAQs for an updated list of compatible printers.
Saving and Printing Data 7 Deskjet 980 Deskjet 990C Deskjet 995 Deskjet 1220C & 1125C Deskjet 3816 & 3820 Deskjet 5550 & 5551 Deskjet 6122 & 6127 Deskjet 5600 & 5100 & 5800 Deskjet 6540 & 6520 Deskjet 5740 Deskjet 6840 Deskjet 3740 & 3840 Deskjet CP1160 & CP1700 Deskjet 9300 & 9600 PhotoSmart PS100 & PS130 & PS230 & PS140 & PS240 & 1000 & 1100 PhotoSmart 320 & 370 PhotoSmart P2500 & P2600 PhotoSmart PS1115 & PS1215 & PS12818 & PS1315 PhotoSmart PS7150 & PS7350 & PS7550 PhotoSmart PS7960 & PS7760 & & PS766
7 Saving and Printing Data Saving oscilloscope data Here are a few points about saving oscilloscope data: • You can save a waveform trace and recall it later. The recalled trace appears in cyan (blue). • You can save oscilloscope setup parameters and recall them later. The setup file stores settings such as horizontal timebase, vertical sensitivity, trigger mode, trigger level, measurements, cursors, and math functions.
Saving and Printing Data 7 Selecting a destination for your saved data Press Save/Recall→Save to access the Save menu and select a destination for saving your data. Press to go/Location/Save to softkey (Using the oscilloscope’s File Explorer) The second softkey from the left in the Save menu is the file explorer softkey. If no USB storage device is connected to the oscilloscope, you will only be able to save Trace and Setup files to the oscilloscope’s internal memory.
7 Saving and Printing Data If one or more USB storage devices are connected to the oscilloscope, you can navigate to the USB device using the same method. The following display image shows an image ready to be saved to a subfolder called “Rise time” on a USB device. Push the Entry knob to save the image. Selecting a file name Overwriting a file You can choose to overwrite an existing file name by browsing to that file and selecting it, then choosing Press to Save.
Saving and Printing Data 7 Spell softkey and press the Enter softkey to create the new file name. 3 You can press the Enter softkey or the Entry knob to move the cursor forward within the file name. 4 You can press the Delete Character softkey to delete the current character and shift the rest of the characters to the left. 5 When you select the Auto Increment option, the oscilloscope will add a numeric suffix to your file name, and increment the number with each successive save.
7 Saving and Printing Data Waveform Trace and Oscilloscope Setup When the Trace & Setup option is selected from the Format softkey, both waveform trace and oscilloscope setup are saved to the USB drive or the oscilloscope’s internal memory. After saving, you can choose to recall the trace, the setup, or both. The trace is saved with the file extension TIF and the setup is saved with the extension SCP.
Saving and Printing Data 7 • ASCII XY data file - This creates a file of comma-separated variables for each displayed channel. If the oscilloscope acquisition is stopped, then data records greater than 1000 points can be written. This format is also suitable for spreadsheets. • BIN data file - This creates a binary file with a header, and data in the form of time and voltage pairs. This file is much smaller than the ASCII XY data file.
7 Saving and Printing Data The Invert Graticule Colors option can be used to reduce the amount of black ink it takes to print oscilloscope images by changing the black background to white. Invert Graticule Colors is the default mode. Invert Graticule Colors is available when the BMP and PNG formats are selected. Graticule Not Inverted Graticule Inverted Palette Press the Palette softkey to change the following options. The Palette options are available when the BMP and PNG formats are selected.
Saving and Printing Data 7 The Length control will perform a “1 of n” decimation of the data when necessary. For example: if the Length is set to 1000, and you are displaying a record that is 5000 data points in length, four of each five data points will be decimated, creating an output file 1000 data points in length. For more information see “Minimum and Maximum Values in CSV Files” on page 353. To save a waveform and/or setup to a USB device 1 Insert a USB drive into the front or rear USB device port.
7 Saving and Printing Data To recall waveform trace and/or oscilloscope setup A recalled trace is typically used for a quick comparison of measurement results. For example, you might save a trace of a waveform to use as a reference, then make a similar measurement on a test system and then recall the saved trace to observe any differences. 1 Press the Save/Recall key. 2 Press the Recall softkey. The Recall Menu will be displayed.
Saving and Printing Data 7 When the USB storage device is connected to the oscilloscope’s front or rear USB host port, a small four-color circle icon may be displayed briefly as the USB device is read. You do not need to “eject” the USB device before removing it. Simply ensure that any file operation you’ve initiated is done, and remove the USB drive from the oscilloscope’s host port.
7 Saving and Printing Data To use the file explorer Files can be loaded and deleted using the file explorer. You can create directories on a USB mass storage device using your PC or other instrument. You can navigate to any directory on the USB device by rotating the Entry knob and pressing the softkey. 1 Connect a USB mass storage device with the files to be loaded or deleted to the USB port on the front or the rear of the oscilloscope.
Saving and Printing Data 7 Secure Environment Mode Option Secure environment mode is compliant to National Industrial Security Program Operating Manual (NISPOM) Chapter 8 requirements. Secure environment mode is called option SEC when it is ordered with the oscilloscope. When adding secure environment mode after oscilloscope purchase, the option is called model N5427A, and the oscilloscope must be returned to an Agilent service center for installation.
7 Saving and Printing Data Table 18 Ordering the Secure Environment Mode Option Ordering the Secure Environment Mode Option 332 New oscilloscope purchase... Order Option SEC. After oscilloscope purchase, if you have not saved confidential trace or setups on the oscilloscope... Order N5427A and return the unit to a Service Center for security license installation. After oscilloscope purchase, if you have saved confidential trace or setups on the oscilloscope...
Agilent 6000 Series Oscilloscope User’s Guide 8 Reference Upgrading to an MSO or adding memory depth 334 Software and firmware updates 334 To set up the I/O port 335 Using the 10 MHz reference clock 336 To supply a sample clock to the oscilloscope 336 To synchronize the timebase of two or more instruments 338 To check warranty and extended services status 338 To return the instrument 339 To clean the oscilloscope 339 Digital channel signal fidelity: Probe impedance and grounding 340 To replace digital prob
8 Reference Upgrading to an MSO or adding memory depth A license can be installed to activate the digital channels of an oscilloscope that was not originally ordered as a mixed-signal oscilloscope (MSO). This includes 6000A Series and 6000L Series oscilloscopes. A mixed signal oscilloscope has analog channels plus 16 time-correlated digital timing channels.
Reference 8 To set up the I/O port The oscilloscope can be controlled via GPIB, LAN, or USB. The oscilloscope’s I/O configuration, including its IP address and hostname, can be viewed by pressing Utility&I/O. To change the I/O controller settings, press the Configure softkey, and choose the I/O connection type (GPIB, LAN, or USB).
8 Reference Using the 10 MHz reference clock The 10 MHz REF BNC connector on the rear panel is provided so you can: • Supply a more accurate sample clock signal to the oscilloscope, or • Synchronize the timebase of two or more instruments. Sample clock and frequency counter accuracy The oscilloscope’s timebase uses a built-in reference that has an accuracy of 15 ppm. This is sufficient for most uses.
Reference 8 2 Press Utility&Options&Rear Panel&Ref Signal. 3 Use the Entry Knob and the Ref Signal softkey to select 10 MHz input. A black locked padlock icon will appear at the top of the display. Reference signal locked 10 MHz input mode selected If the externally supplied sample clock varies greater than 0.5% from 10 MHz a soft unlock will occur. The oscilloscope will continue to acquire data but the lock symbol in the upper right part of the display will become a red unlocked padlock icon.
8 Reference To synchronize the timebase of two or more instruments The oscilloscope can output it’s 10 MHz system clock for the purpose of synchronization with other instruments. 1 Connect a BNC cable to the BNC connector labeled 10 MHz REF on the rear panel of the oscilloscope. 2 Connect the other end of the BNC cable to the instrument(s) that will accept the 10 MHz reference signal. Put a 50 Ω termination at the input to the other instrument to terminate the signal.
Reference 8 To return the instrument Before shipping the oscilloscope to Agilent Technologies, contact your nearest Agilent Technologies sales or service office for additional details. Information on contacting Agilent Technologies can be found at www.agilent.com/find/contactus. 1 Write the following information on a tag and attach it to the oscilloscope.
8 Reference Digital channel signal fidelity: Probe impedance and grounding You may encounter problems when using the mixed-signal oscilloscope that are related to probing. These problems fall into two categories: probe loading and probe grounding. Probe loading problems generally affect the circuit under test, while probe grounding problems affect the accuracy of the data to the measurement instrument.
Reference 8.5 pF Figure 49 100 kW DC and Low-Frequency Probe Equivalent Circuit 250 W 1 pF Figure 50 8 7.5 pF 100 kW 150 W High-Frequency Probe Equivalent Circuit The impedance plots for the two models are shown in these figures. By comparing the two plots, you can see that both the series tip resistor and the cable’s characteristic impedance extend the input impedance significantly. The stray tip capacitance, which is generally small (1 pF), sets the final break point on the impedance chart.
8 Reference 100 k Ω 10 k Ω High Frequency Model Impedance 1kΩ Typical Model 100 Ω 10 Ω 1Ω 10 kHz 100 kHz 1 MHz 10 MHz 100 MHz 1 GHz Frequency Figure 51 Impedance versus Frequency for Both Probe Circuit Models The logic probes are represented by the high-frequency circuit model shown above. They are designed to provide as much series tip resistance as possible. Stray tip capacitance to ground is minimized by the proper mechanical design of the probe tip assembly.
Reference 8 Sharing one probe ground with many probes forces all the current that flows into each probe to return through the same common ground inductance of the probe whose ground return is used. The result is increased current (di) in the above equation, and, depending on the transition time (dt), the common mode voltage may increase to a level that causes false data generation.
8 Reference Best Probing Practices Because of the variables L, di, and dt, you may be unsure how much margin is available in your measurement setup. The following are guidelines for good probing practices: • The ground lead from each digital channel group (D15–D8 and D7–D0) should be attached to the ground of the circuit under test if any channel within the group is being used for data capture.
Reference 8 To replace digital probe leads If you need to remove a probe lead from the cable, insert a paper clip or other small pointed object into the side of the cable assembly, and push to release the latch while pulling out the probe lead.
8 Reference Binary Data (.bin) The binary data format stores waveform data in binary format and provides data headers that describe that data. Because the data is in binary format, the size of the file is approximately 5 times smaller than the XYPairs format. If more than one source is on, you will save all displayed sources, except math functions, to a file.
Reference File Size 8 A 32-bit integer that is the number of bytes that are in the file. Number of Waveforms A 32-bit integer that is the number of waveforms that are stored in the file. Waveform Header It is possible to store more than one waveform in the file, and each waveform stored will have a waveform header. The waveform header contains information about the type of waveform data that is stored following the waveform data header.
8 Reference X Display Range A 32-bit float that is the X-axis duration of the waveform that is displayed. For time domain waveforms, it is the duration of time across the display. If the value is zero then no data has been acquired. X Display Origin A 64-bit double that is the X-axis value at the left edge of the display. For time domain waveforms, it is the time at the start of the display. This value is treated as a double precision 64-bit floating point number.
Reference 8 Time A16-bit character array, left blank in the 6000 Series oscilloscope. Frame A 24 byte character array that is the model number and serial number of the oscilloscope in the format of: MODEL#:SERIAL#. Waveform Label A 16 byte character array that contains the label assigned to the waveform. Time Tags A 64-bit double, not used in the 6000 Series oscilloscope. Segment Index A 32-bit unsigned integer, not used in the 6000 Series oscilloscope.
8 Reference Waveform Data Header A waveform may have more than one data set. Each waveform data set will have a waveform data header. The waveform data header consists of information about the waveform data set. This header is stored immediately before the data set. Waveform Data Header Size A 32-bit integer that is the size of the waveform data header. Buffer Type A 16-bit short that is the type of waveform data stored in the file: • 0 = Unknown data. • 1 = Normal 32-bit float data.
Reference 8 Examples of Binary Files Single Acquisition Multiple Analog Channels The following picture shows a binary file of a single acquisition with multiple analog channels.
8 Reference Single Acquisition All Pods Logic Channels The following picture shows a binary file of a single acquisition with all pods for the logic channels saved.
Reference 8 Minimum and Maximum Values in CSV Files If you are running a Quick Measurement Minimum or Maximum measurement, the minimum and maximum values shown in the Quick Measurement display may not appear in the CSV file. Explanation: When the oscilloscope’s sample rate is 4 GSa/s, a sample will be taken every 250 ps. If the sweep speed is set to 100 ns/div, there will be 1000 ns of data displayed (because there are ten divisions across the screen).
8 354 Reference 6000 Series Oscilloscope User’s Guide
Agilent 6000 Series Oscilloscope User’s Guide 9 Power and Environmental Conditions Power Requirements 356 Measurement Category 357 Environmental Conditions 359 Specifications 360 Acknowledgements 360 Contact us 361 This chapter describes the power requirements and environmental conditions appropriate for the Agilent InfiniiVision 6000 Series oscilloscopes.
9 Power and Environmental Conditions Power Requirements Line voltage range ~Line 120 W max, 96-144 V/48-440 Hz, 192-288 V/48-66 Hz, automatic selection Line frequency 50/60 Hz, 100-240 VAC; 440 Hz, 100-132 VAC Power usage 110 W max 356 6000 Series Oscilloscope User’s Guide
Power and Environmental Conditions 9 Measurement Category Measurement Category The 6000 Series oscilloscope is intended to be used for measurements in Measurement Category I. WA R N I N G Use this instrument only for measurements within its specified measurement category. Measurement Category Definitions Measurement category I is for measurements performed on circuits not directly connected to MAINS.
9 Power and Environmental Conditions Transient Withstand Capability CAUTION Maximum input voltage for analog inputs CAT I 300 Vrms, 400 Vpk; transient overvoltage 1.6 kVpk CAT II 100 Vrms, 400 Vpk with N2863A 10:1 probe: CAT I 600 V, CAT II 300 V (DC + peak AC) with 10073C 10:1 probe: CAT I 500 Vpk, CAT II 400 Vpk with 50 Ω input: 5 Vrms CAUTION 358 Do not exceed 5 Vrms in 50 Ω mode on the 2-channel models.
Power and Environmental Conditions 9 Environmental Conditions Environment Indoor use only. Ambient temperature Operating –10 °C to +55 °C; non-operating –51 °C to +71 °C Humidity Operating 95% RH at 40 °C for 24 hr; non-operating 90% RH at 65 °C for 24 hr Altitude Operating to 4,570 m (15,000 ft); non-operating to 15,244 m (50,000 ft) Overvoltage Category This product is intended to be powered by MAINS that comply to Overvoltage Category II, which is typical of cord-and-plug connected equipment.
9 Power and Environmental Conditions Specifications Please see the InfiniiVision 6000 Series Oscilloscopes Data Sheet for complete, up-to-date specifications and characteristics. To download a copy of the data sheet please visit: www.agilent.com/find/mso6000 and select Library, then select Specifications. Or go to the Agilent home page at www.agilent.com and search for 6000 series oscilloscopes data sheet. To order a data sheet by phone, please contact your local Agilent office.
9 Contact us Americas Canada (877) 894-4414 Latin America 305 269 7500 United States (800) 829-4444 Asia Pacific Australia 1 800 629 485 China 800 810 0189 Hong Kong 800 938 693 India 1 800 112 929 Japan 81 426 56 7832 Korea 080 769 0800 Malaysia 1 800 888 848 Singapore 1 800 375 8100 Taiwan 0800 047 866 Thailand 1 800 226 008 Europe Austria 0820 87 44 11 Belgium 32 (0) 2 404 93 40 Denmark 45 70 13 15 15 Finland 358 (0) 10 855 2100 France 0825 010 700 Germany 01805 24 6333* *0.
9 362 6000 Series Oscilloscope User’s Guide
Index Symbols (-)Width measurement, 246 (+)Width measurement, 246 Numerics 1*2 math function, 215 1-2 math function, 217 232, 109 6000L, 8, 21 A about oscilloscope, 108 AC adapter, 36 AC channel coupling, 85 accessories, 22, 26, 27 acquire, 268 acquisition memory, 130 acquisition mode, 265 averaging, 267, 268 high resolution, 266 normal, 266 peak detect, 266 acquisition option realtime, 269 active probes, 56 active serial bus, 275, 279, 284, 293 activity indicator, 118 adding digital channels license, 334
Index channel analog, 83 bandwidth limit, 86 coupling, 85 invert, 86 on/off keys, 70 position, 84 probe units, 87 skew, 87 vernier, 84 vertical sensitivity, 84 channel pair, 270 charging indicator, 34, 36 choosing values, 66 cleaning, 339 clear display, 261, 310 clock, 102 CMOS threshold, 121 communicating with the oscilloscope, 38 comparison of measurement results, 328 compensate probes, 64, 69 compensating your probe, 54 Configure softkey, 39 connect probes analog, 51 digital, 112 connect the dots, 262 c
Index file keys, 70 file name, new, 322 firmware updates, 334 firmware version information, 43 Flat top window, 226 FlexRay frame counter, 298 FlexRay serial decode, 294 FlexRay totalizer, 298 FlexRay trigger, 155 format waveform, 324 FPG, 109 frame trigger, I2C, 167, 168 Frequency measurement, 244 front panel, 8, 21 front-panel, 68, 74 overview, 61 FRS, 109 G gateway IP, 39 glitch trigger, 142 GPIB control, 335 grabber, 113, 114 graphic conventions, 67 graticule, 76 grid intensity, 76 ground level, 84 gr
Index Maximum measurement, 251 maximum sample rate, 270 measure keys, 72 measurement category definitions, 357 measurement definitions, 244 measurement line, 75 measurement thresholds, 241 measurements, 96, 315 MegaZoom III, 4 mem2M license, 109 mem8M license, 109 memory depth, 78 upgrade, 334 memXM, 109 Menu/Zoom key, 72 Minimum measurement, 251 missing acknowledge condition, I2C trigger, 166 Mode/Coupling key, trigger, 130 model number, 43 Modify softkey, 39 MSO, 4, 109 MSO feature upgrade, 334 MSO licen
Index replacement parts, 345 reset LAN, 40 restart condition, I2C trigger, 166 return instrument for service, 339 Rise time measurement, 246 RMS measurement, 252 roll mode, 93 run controls, 71 Run/Stop key, 77 runt pulses, 245 S sample rate, 5, 266, 270 current rate displayed, 88 save browse to destination, 321 formats, 324 settings, 325 save file, 328 Save to, 321 save trace to scope memory, 327 to USB, 327 save waveform to scope memory, 327 to USB, 327 saver, screen, 103 saving data, 320 SCL, I2C trigge
Index trigger type, 139 CAN, 148 duration, 152 edge, 140 FlexRay, 155 glitch, 142 hex bus, 147 I2C, 164 LIN, 172 Nth edge burst, 170 pattern, 145 pulse width, 142 sequence, 175 slope, 140 SPI, 182 TV, 187 UART/RS232, 199 USB, 204 triggers, 206 TTL threshold, 121 turn channel on, 70 TV trigger, 187 U UART totalizer, 306 UART/RS232 frame counter, 306 UART/RS232 license, 109 UART/RS232 serial decode, 300 UART/RS232 trigger, 199 undo AutoScale, 80 units, math, 214 units, probe, 87, 138 unstable triggers, 269