
User`s guide


6 Measurements and Math Functions
240 InfiniiVision Oscilloscopes User’s Guide
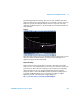
You can make peak-to-peak, maximum, minimum, and average dB measurements on
the FFT waveform. You can also find the frequency value at the first occurrence of the
waveform maximum by using the X at Max Y measurement.
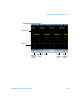
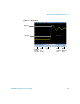
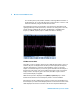
The following FFT spectrum was obtained by connecting the front panel Probe Comp
signal (approximately 1.2 kHz square wave) to channel 1. Set sweep speed to 5 ms/div,
vertical sensitivity to 500 mV/div, Units/div to 10 dBV, Offset to -34.0 dBV, Center
frequency to 5.00 kHz, frequency Span to 10.0 kHz, and window to Hanning.
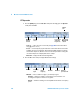
FFT Measurement Hints
The number of points acquired for the FFT record is 1000 and when frequency span is at
maximum, all points are displayed. Once the FFT spectrum is displayed, the frequency
span and center frequency controls are used much like the controls of a spectrum
analyzer to examine the frequency of interest in greater detail. Place the desired part of
the waveform at the center of the screen and decrease frequency span to increase the
display resolution. As frequency span is decreased, the number of points shown is
reduced, and the display is magnified.
While the FFT spectrum is displayed, use the [Math] and [Cursors] keys to switch
between measurement functions and frequency domain controls in FFT Menu.
Decreasing the effective sampling rate by selecting a slower sweep speed will increase
the low frequency resolution of the FFT display and also increase the chance that an alias
will be displayed. The resolution of the FFT is the effective sample rate divided by the