Agilent Infiniium 9000 Series Oscilloscopes Evaluation Guide The most recent PDF version of this guide will be placed on the Agilent web site at: http://cp.literature.agilent.com/litweb/pdf/N2918-97003.
Notices © Agilent Technologies, Inc. 2009 No part of this manual may be reproduced in any form or by any means (including electronic storage and retrieval or translation into a foreign language) without prior agreement and written consent from Agilent Technologies, Inc. as governed by United States and international copyright laws. Manual Part Number N2918-97003 Edition Third edition, August 2009 Printed in U.S.A. Agilent Technologies, Inc. 1900 Garden of the Gods Rd.
Agilent Infiniium 9000 Series Oscilloscope Evaluation Guide Does your job require an oscilloscope that can adapt to a wide variety of debug and test challenges? Agilent engineers developed the Infiniium 9000 Series oscilloscopes with the industry’s broadest measurement capability. What gives the Infiniium 9000 Series the industry’s broadest measurement capability? 1. Best Fit for Workspace Oscilloscopes are visual tools and large, high-resolution displays make the product better.
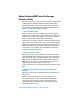
Required Equipment • Agilent Infiniium 9000 Series oscilloscope. • Two passive probes. • Demo kit with demo board and USB cable. Demo board connections: MSO Cable Connection (Digital Inputs) MODE Action Select Knob Power or Power is provided via USB or MSO cable.
In This Guide If you are experiencing the Infiniium 9000 Series oscilloscope for the first time, begin with Lab 1, the Getting Started Guide. If you have a basic knowledge of the Infiniium 9000 Series oscilloscope’s front-panel controls, begin with Lab 2. Topic Page Time Allowance Lab 1: Getting Started 7 10 min. Lab 2: Viewing Complex Signals 22 10 min. Lab 3: Uncovering Signal Anomalies with Responsive Deep Memory 26 10 min. Lab 4: InfiniiScan Triggering 29 5 min.
Agilent Infiniium 9000 Series Oscilloscope Evaluation Guide
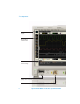
Agilent Infiniium 9000 Series Oscilloscopes Evaluation Guide 1 Getting Started If you are not familiar with the Agilent Infiniium 9000 Series oscilloscopes, please first look over the main sections of the front panel as illustrated and then follow the exercises.
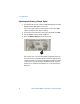
1 Getting Started 15" XGA touch screen display Drag-and-drop measurements Status tab shows current settings Mixed-signal oscilloscope (MSO) cable connection AutoProbe interface 8 Agilent Infiniium 9000 Series Oscilloscope Evaluation Guide
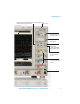
Getting Started 1 Selection knob, immediate action keys, and special menus Push the knob to toggle selection Run Control Time/div and position horizontal controls Trigger level knob and controls Digital button for mixed-signal oscilloscope (MSO) channels D0 – D15 Serial Decode button for quick decode access Color-coded controls for each oscilloscope channel USB ports Agilent Infiniium 9000 Series Oscilloscope Evaluation Guide 9
1 Getting Started Capturing and Viewing a Simple Signal 1 To power the demo board, connect a USB cable between it and the Agilent Infiniium 9000 Series oscilloscope. You can also apply power by connecting the oscilloscope’s MSO cable to the demo board’s 40-pin connector. 2 Connect the scope channel 1 probe to demo board CH1 and GND. 3 Turn the SELECT switch to position 3 (Burst). 4 Press the [Default Setup] key on the front panel. Press The oscilloscope is now set in the default configuration.
Getting Started 1 5 Press [AutoScale]. The oscilloscope will analyze all active channels, turning them on and setting the time base, V/div, and trigger conditions for an initial display.
1 Getting Started Horizontal Control 1 Turn the large Horizontal scale knob clockwise and counter-clockwise to control the time/div setting of the horizontal axis. Observe the changes in the displayed signal. The current time base setting is displayed in the lower middle of the screen. 2 Turn the small Horizontal position knob to move the waveform horizontally from the trigger point. Push this knob to center (zero) the trigger point.
Getting Started 1 Run Control When the oscilloscope is turned on, or if [AutoScale] is pressed, the acquisition will be set to [Run]. At any time, you may [Stop] the acquisition process to examine a signal in detail or to save it. 1 Press [AutoScale] to return to simple setup. 2 Set the time base to 2 ms/div. 3 Press the [Single] key to make a single acquisition and stop the acquisition process. 4 Use the large Horizontal scale knob to zoom in on the waveform.
1 Getting Started Acquisition Controls 1 From the on-screen main menu, choose Setup>Acquisition.... Note the sampling mode, manual memory depth, averaging, and manual sampling rate options. 2 Click Close.
Getting Started 1 Vertical Controls 1 Press [AutoScale] to return to simple setup. 2 Turn the large channel 1 (yellow) Vertical scale knob to control the V/div setting. The V/div setting is displayed at the top of the screen for each channel. Press Knobs are color coded to match the waveform color. Push the vertical scale knob for vernier fine adjustment. 3 Press the [1] key to turn the channel off. Press [1] again to turn the channel on.
1 Getting Started Trigger Controls 1 Press [AutoScale] to return to a simple setup. 2 Set the time base to 50 ns/div. 3 Rotate the trigger level knob up and down. The trigger level is displayed while it is adjusted. Move trigger level up and down on signal If the trigger level is above or below the signal, the oscilloscope will force a trigger and display a waveform when in Auto mode.
Getting Started 1 Making Measurements The easiest way to make measurements is to drag-and-drop measurement icons. 1 Press [AutoScale] to return to a simple setup. 2 Drag a measurement icon from the left-hand side of the screen to a waveform. 3 When the icon border changes to the color of the desired waveform, drop the icon.
1 Getting Started After dropping the measurement icon on a waveform, markers for the measurement appear on screen, and the measurement data appears in the bottom portion of the screen. You can also set up the [Multi Purpose] key to display quick measurements. To do this: 1 From the on-screen main menu, choose Utilities>Customize Multipurpose....
Getting Started 1 2 In the Customize Multipurpose dialog, select QuickMeas from the top drop-down; then, select the quick measurements you want, and click Close. 3 Now, press the [Multi Purpose] key.
1 Getting Started The quick measurement data appears in the bottom portion of the screen. Note that the [Multi Purpose] key can also be customized to: • QuickPrint — to print the screen image. • QuickScreen — to save the screen image to a file. • QuickSetup — to load a setup file. • QuickWaveform — to save waveform data. • QuickExecute — to run a program. Using Markers 1 Press the [Markers] key on front panel.
1 Getting Started 3 Drag the Ax marker to the leading edge on the CH1 waveform. 4 Drag the Bx marker to the last edge on the CH1 waveform. The bottom portion of the screen shows the values of each marker and their deltas. Saving Data, Setups, or Images You can save images, waveform data, or setups to a variety of media including the local hard drive or USB host ports. From the on-screen main menu, choose File>Save> and then the type of file you want to save.
Agilent Infiniium 9000 Series Oscilloscopes Evaluation Guide 2 Viewing Complex Signals Video signals have been the ultimate display challenge for digitizing oscilloscopes. These complex signals have long been considered the display standard by which the display performance of digitizing oscilloscopes have been compared to analog oscilloscope display technology.
Viewing Complex Signals 2 Then, click Close. 10 Adjust the volts/div setting to 500 mV/div. 11 Wave your hand over the demo board’s video camera lens to observe the good display update rate of the oscilloscope. Set acquisition options: 12 From the on-screen main menu, choose Setup>Acquisition....
2 Viewing Complex Signals 13 In the Acquisition Setup dialog, select: Then, click Close. 14 Press [Single] to obtain one acquisition using the maximum memory depth of the oscilloscope.
Viewing Complex Signals 2 15 Using the large Horizontal scale knob, adjust the time base setting down to 2 µs/div to zoom in on the color burst.
Agilent Infiniium 9000 Series Oscilloscopes Evaluation Guide 3 Uncovering Signal Anomalies with Responsive Deep Memory An amplitude modulated (AM) signal is a very complex modulated waveform where a high-definition display and deep memory are needed for successful capture, viewing and analysis. In this lab, we will capture an AM signal that includes an embedded anomaly (a glitch).
Uncovering Signal Anomalies with Responsive Deep Memory 3 In this lab, a stable trigger is accomplished by triggering on the synchronization signal on channel 2. In the absence of a synchronization signal, trigger holdoff can be used to achieve a stable trigger (see Appendix A). 7 Turn off the channel 2 display (still the trigger source) by pressing the [2] key. 8 Re-adjust channel 1’s vertical scale to 500 mV/div and its vertical position to 2.
3 Uncovering Signal Anomalies with Responsive Deep Memory Take advantage of deep memory: zoom in on one of the glitches to see the details: Step 1: Using the small Horizontal position knob, move one of the glitches to the center of the display. Step 2: Using the large Horizontal time/div knob, set the time base to 500 ns/div (turn clockwise) to see characteristics of the glitch in detail.
Agilent Infiniium 9000 Series Oscilloscopes Evaluation Guide 4 InfiniiScan Triggering Capturing infrequent or hard to describe anomalies such as random glitches requires oscilloscopes with innovative technology. InfiniiScan is a software-based post-processing technology that makes it easy to isolate anomalies. This lab requires an InfiniiScan option license.
4 InfiniiScan Triggering Then, click Close. 10 In the waveform area, draw a box around the area where an occasional glitch occurs.
InfiniiScan Triggering 4 11 Release the mouse button and select Zone 1>AND Must Intersect. The oscilloscope now triggers and captures only waveforms where the glitch occurs. InfiniiScan can be extremely effective in isolating cycles such as DDR reads and writes, or in triggering on events that are difficult to describe with traditional oscilloscope triggers.
Agilent Infiniium 9000 Series Oscilloscopes Evaluation Guide 5 Mixed-Signal Oscilloscope (MSO) In mixed analog and digital designs, it is often important to view multiple analog and digital channels, which is significantly beyond the capability of a 2- or 4-channel oscilloscope.
5 Mixed-Signal Oscilloscope (MSO) The channel 1 signal (yellow) is the filtered version of the output. The channel 2 signal (green) shows the stair-step output of a microcontroller-based Digital-to-Analog Converter (DAC). Channels D0 – D7 (blue) are the input control lines to the DAC. We were able to easily trigger on channel 2.
5 Mixed-Signal Oscilloscope (MSO) 9 In the Digital Setup dialog’s Bus 1 tab, select: Then, click Close. Set up the trigger: To trigger on a bus value: 10 Choose Trigger>Setup Trigger... (or press [Menu] in the front panel Trigger controls).
Mixed-Signal Oscilloscope (MSO) 5 11 In the Trigger Setup dialog, select: Then, click Close. 12 Set the time base to 20 µs/div. At center screen, notice the Bus 1 value.
Agilent Infiniium 9000 Series Oscilloscopes Evaluation Guide 6 USB Agilent offers a USB compliance package as well as a USB protocol triggering and decode application. The compliance package tests for signal conformance to USB-IF industry standard while the protocol triggering and decode application targets rapid debug. For this exercise, a USB protocol application option license is required. USB is a differential serial bus and can run at low-, full-, or high-speed data rates.
6 USB 4 Connect the scope channel 2 probe to demo board D- probe loop 5 6 7 8 and GND. Remove all other probes and connections. If you have the MSO cable connected to the demo board’s 40-pin connector, turn the SELECT switch to position 0 (so digital channels aren’t captured). Press [Default Setup]. Press [AutoScale]. You are now viewing low-speed serial traffic between a mouse and the PC in the oscilloscope. 9 Set the time base to 20 µs/div to see a single packet.
6 USB Here’s the associated protocol view. Select the Payload tab. The data packets include X-Y coordinates that were transmitted when you moved the mouse. Move the mouse and see the X-Y coordinate information change in the Payload tab. USB Full-Speed Capture Make connections and perform initial setup: 12 Disconnect the mouse from the demo board USB-A port. 13 Connect a full-speed device to the USB-A connector on the demo board. Full speed hubs or older thumb drives make ideal candidates.
6 USB Set up serial decode: 16 Choose Setup>Serial Decode.... 17 In the Serial Decode dialog, select: Then, click Auto Setup and Close. Auto Setup sets the sample rate, memory depth, measurement thresholds, trigger levels, and holdoff to correctly decode the specified protocol. You are now viewing USB full speed traffic. To make the protocol decode more interesting, let’s watch traffic that is more varied.
6 USB 20 Click on either a Data 1 or a Data 0 packet row; then, select the Payload tab to see the packet contents.
USB 6 Set up the trigger: 21 Choose Trigger>Setup Trigger... (or press [Menu] in the front panel Trigger controls). 22 In the Trigger Setup dialog, select: Then, click Close. 23 Press [Single] and note that the oscilloscope triggers when it sees the first DATA0 packet.
6 USB USB High-Speed Capture Make connections and perform initial setup: 24 Connect a high speed storage device to the USB-A connector on the demo board. Most recent thumb drives make excellent devices for this. 25 Connect an InfiniiMax differential probe with socketed probe head adapter to the demo board’s USB high-speed connector. Use oscilloscope channel 3. This connection has built-in 82 ohm termination.
6 USB 29 In the Serial Decode dialog, select: Then, click Auto Setup and Close. You are now viewing USB high speed traffic. To make the protocol decode more interesting, let’s watch traffic that is more varied. 30 Copy any large file (a 100M file generates just a few seconds of traffic and works well) from a thumb drive plugged into the demo board to the Infiniium 9000 Series desktop (or vice versa). 31 Press [Single] to capture a single trace.
6 USB Set up the trigger: 33 Choose Trigger>Setup Trigger... (or press [Menu] in the front panel Trigger controls). 34 In the Trigger Setup dialog, select: Then, click Close. 35 Press [Single]. The oscilloscope triggers when it sees the first DATA0 packet.
Agilent Infiniium 9000 Series Oscilloscopes Evaluation Guide 7 I 2C To enable I2C serial decode, your oscilloscope has to have the I2C/SPI protocol option installed. (The installed options are listed in the Help>About Infiniium... dialog.) Make connections and perform initial setup: 1 To power the demo board, connect a USB cable between it and the Agilent Infiniium 9000 Series oscilloscope. You can also apply power by connecting the oscilloscope’s MSO cable to the demo board’s 40-pin connector.
7 I2 C 9 In the Serial Decode dialog, select: Then, click Auto Setup and Close. 10 Press [Single]. 11 Set the time base to 1 ms/div. As you move the blue vertical marker in the waveform display, it tracks in the protocol viewer window. As you click on rows in the protocol viewer, the blue marker shows the exact associated time in the waveform menu.
I2C 7 Set up the trigger: 12 Choose Trigger>Setup Trigger... (or press [Menu] in the front panel Trigger controls). 13 In the Trigger Setup dialog, select: Then, click Close. 14 Press [Single] or [Run].
7 I2 C 15 In the protocol decode viewer, select the Payload tab. 16 Select the Header tab to see a data sheet view of the acquired protocol.
Agilent Infiniium 9000 Series Oscilloscopes Evaluation Guide 8 SPI To enable SPI serial decode, your oscilloscope has to have the I2C/SPI option installed. (The installed options are listed in the Help>About Infiniium... dialog.) Make connections and perform initial setup: 1 Connect the MSO cable between the oscilloscope and the demo board’s 40-pin connector. This powers the demo board and probes its digital signals.
8 SPI 7 In the Serial Decode dialog, select: Then, click Auto Setup and Close. Set up the trigger: 8 Choose Trigger>Setup Trigger... (or press [Menu] in the front panel Trigger controls).
SPI 8 9 In the Trigger Setup dialog, select: Then, click Close. 10 Change the time base setting to 500 µs/div to easily see the serial decode.
8 SPI As you move the blue vertical marker in the waveform display, it tracks in the protocol viewer window. As you click on rows in the protocol viewer, the blue marker shows the exact associated time in the waveform menu. SPI Using Analog Channels You can also capture SPI signals by connecting the oscilloscope’s analog channels to the proper signals on the demo board’s 40-pin connector.
SPI 8 3 Turn the SELECT switch to position 6 (SPI). 4 Press [Default Setup]. 5 Press [AutoScale]. Set up serial decode: 6 Choose Setup>Serial Decode.... 7 In the Serial Decode dialog, select: Then, click Auto Setup and Close. Set up the trigger: 8 Set up the trigger the same as in the previous section.
8 SPI 9 Change the time base setting to 500 µs/div to easily see the serial decode.
Agilent Infiniium 9000 Series Oscilloscopes Evaluation Guide 9 CAN To enable CAN serial decode, your oscilloscope has to have the CAN/FlexRay serial bus protocol option installed. (The installed options are listed in the Help>About Infiniium... dialog.) Make connections and perform initial setup: 1 To power the demo board, connect a USB cable between it and the Agilent Infiniium 9000 Series oscilloscope.
9 CAN 8 Press [Single]. 9 Move the mouse pointer over the serial decode symbols; then, click and drag the decode symbols below the waveform. 10 In the Decode window, click Search.... 11 In the Serial Search dialog, enable searching and triggering on error frames: Then, click Close. 12 Press [Run].
Agilent Infiniium 9000 Series Oscilloscopes Evaluation Guide 10 RS-232 The RS-232/UART serial triggering and decode option displays responsive, time-aligned, on-screen decode of RS-232 and other UART serial buses. It provides triggering capabilities on specified transmit or receive values, as well as on parity errors. To enable RS-232/UART serial decode, your oscilloscope must have the RS-232 option installed. (The installed options are listed in the Help>About Infiniium... dialog.
10 RS-232 Set up serial decode: 7 Choose Setup>Serial Decode....
RS-232 10 Then, click Auto Setup and Close. 9 In the Decode window, select the ASCII display format. Set up the trigger: 10 Choose Trigger>Setup Trigger... (or press [Menu] in the front panel Trigger controls).
10 RS-232 11 In the Trigger Setup dialog, select: Then, click Close. 12 Press [Run].
Agilent Infiniium 9000 Series Oscilloscopes Evaluation Guide 11 Segmented Memory Agilent’s segmented memory feature can optimize your oscilloscope’s acquisition memory, allowing you to capture more selective signal details with less memory and then easily view all captured waveforms and scroll through each individual waveform segment. Make connections and perform initial setup: 1 To power the demo board, connect a USB cable between it and the Agilent Infiniium 9000 Series oscilloscope.
11 Segmented Memory 11 In the Acquisition Setup dialog, select: Then, click Close. 12 Press [Single] to capture the desired number of segments. After the acquisition completes, notice the bottom portion of the screen has a tab for navigating through the segmented memory waveforms.
Segmented Memory 11 13 Use the forward, back, start, and end buttons to play through the acquired segments one by one. 14 Enter a play rate of 100 ms, and click Play to play back all the captured segments. Note that time tags are kept for each segment.
11 Segmented Memory Combining Segmented Memory with Serial Triggering and Decode Many serial buses have long periods of inactivity between bursts of packets. Using segmented memory with serial decode and triggering enables the oscilloscope to maximize the captured time window. 1 Make the I2C demo board connections, perform initial setup, set up serial decode, and set up the trigger as shown in “I2C" on page 45. 2 Set up the segmented memory acquisition as shown in “Set acquisition options:" on page 61.
Agilent Infiniium 9000 Series Oscilloscopes Evaluation Guide 12 Histograms Histograms give you an easy way to evaluate statistics associated with waveforms. The low-cost demo board produces noise that appears as thick traces for any oscilloscope that captures its signals. Use a histogram to measure the amount of this noise. Make connections and perform initial setup: 1 To power the demo board, connect a USB cable between it and the Agilent Infiniium 9000 Series oscilloscope.
12 Histograms 11 In the Histogram dialog, select: Then, click Close. Note the standard deviation and the number of total hits analyzed.
Agilent Infiniium 9000 Series Oscilloscopes Evaluation Guide A Using Trigger Holdoff to Synchronize Acquisition/Display on Complex Signals Triggering on simple repetitive signals is easy using standard edge triggering. But if you need to synchronize your oscilloscope’s acquisitions/display on more complex signals, such as an amplitude-modulated signal, you will need to use your oscilloscope’s trigger hold-off capability unless there is an external synchronization signal available.
A Using Trigger Holdoff to Synchronize Acquisition/Display on Complex Signals 6 Press [AutoScale]. Note that AutoScale sets up the triggering and horizontal display based on the carrier signal. However, our desire is to set up the oscilloscope’s triggering based on the envelope of this complex AM signal. 7 Change time base setting to 100 µs/div. Note that the oscilloscope will appear to be untriggered. 8 Press the [Run/Stop] key.
A Using Trigger Holdoff to Synchronize Acquisition/Display on Complex Signals 9 Adjust trigger level to approximately 3 volts, which is down approximately 1/3 below the highest peak. Using this level will provide potential re-arm times during the valleys of the envelope. 10 Estimate the cycle time of this complex signal – note that there are two unique envelopes per cycle time (use markers if you wish). Note that the cycle time is approximately 450 µs.
A Using Trigger Holdoff to Synchronize Acquisition/Display on Complex Signals 14 In the Trigger Conditioning dialog, select the Fixed holdoff mode and enter a holdoff time of 400 µs. 15 Click Close to close the open dialogs. Holdoff is an under-utilized tool that can achieve stable trigger conditions on complex signals.
PC31 ␜ᵄེ㒝ઙ OSCILLOSCOPE ACCESSORY ㇱઙฬ⒓ Part Name Metal chassis and panels Metal fasteners Machined parts Connectors Cables Printed circuit assemblies Other parts O: Ქኂ‛凝 Ქኂ‛凝ᚗర⚛ Toxic or Hazardous Substances and Elements 卋 Pb ᳮ Hg 叏 Cd ચ卲 卲 ચ Cr6+ ᄙᄽ侶⧶ ᄽ侶⧶ PBB ᄙᄽੑ⧶ㅘ ੑ⧶ㅘ PBDE } } ´ ´ ´ ´ } } } } } } } } } ´ } } } ´ } ´ ´ } ´ } } } } } } } } } } } } } } } } } ! " #$%&'(" SJ/T))363-2006 *+,.
www.agilent.com Agilent Technologies, Inc. 2009 Printed in U.S.A.