
Technical data

3-26 Service Guide N5230-90025
Tests and Adjustments PNA Series Microwave Network Analyzers
System Verification N5230C
Interpreting the Verification Results
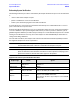
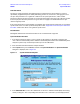
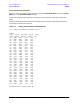
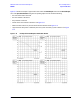
Figure 3-11 shows an example of typical verification results with Print Tabular Data selected in the Printer
Output area of the System Verification dialog box.
At the top of the printed output is the name of the device, the serial number of the device, and the date
tested.
Each S-parameter measurement result is printed with frequency tested, lower and upper limit lines, the
measured data, and the result of the test.
Figure 3-11 Example of Printed Tabular Verification Results
Sys Ver -- 20 dB attenuator magnitude results, Serial #00810 -- 6 Sep 2000
S11 Results
Frequency Lower Limit Measured Data Upper Limit Result
0.3 MHz 0.0048 Units 0.0090 Units 0.0139 Units PASS
100 0.0046 0.0091 0.0137 PASS
200 0.0042 0.0092 0.0134 PASS
300 0.0040 0.0091 0.0133 PASS
400 0.0038 0.0089 0.0131 PASS
500 0.0036 0.0087 0.0129 PASS
600 0.0034 0.0085 0.0127 PASS
700 0.0031 0.0082 0.0125 PASS
800 0.0029 0.0080 0.0122 PASS
900 0.0026 0.0079 0.0119 PASS
1000 0.0023 0.0075 0.0117 PASS
1100 0.0020 0.0072 0.0114 PASS
1200 0.0017 0.0068 0.0111 PASS
1300 0.0013 0.0064 0.0107 PASS
1400 -0.0006 0.0059 0.0118 PASS
1500 -0.0011 0.0052 0.0113 PASS
1600 -0.0015 0.0044 0.0108 PASS
1700 -0.0020 0.0038 0.0103 PASS
1800 -0.0026 0.0032 0.0097 PASS
1900 -0.0031 0.0024 0.0091 PASS
2000 -0.0036 0.0019 0.0085 PASS
2100 -0.0045 0.0016 0.0082 PASS
2200 -0.0050 0.0018 0.0077 PASS
2300 -0.0054 0.0023 0.0073 PASS
2400 -0.0052 0.0031 0.0075 PASS
2500 -0.0048 0.0039 0.0080 PASS
2600 -0.0040 0.0050 0.0087 PASS
2700 -0.0032 0.0060 0.0094 PASS
2800 -0.0024 0.0071 0.0103 PASS
2900 -0.0014 0.0082 0.0113 PASS
3000 -0.0004 0.0095 0.0124 PASS
Overall PASS/FAIL result for entire frequency range = PASS