
Stereo System User Manual


154 Chapter 12
Noise Figure Measurement Application
General Specifications
General Specifications
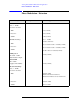
Description Specifications Supplemental Information
Noise Figure
Uncertainty Calculator
a
a. The figures given in the table are for the uncertainty added by the X-Series Signal Analyzer instrument
only. To compute the total uncertainty for your noise figure measurement, you need to take into account
other factors including: DUT NF, Gain and Match, Instrument NF, Gain Uncertainty and Match; Noise
source ENR uncertainty and Match. The computations can be performed with the uncertainty calcula-
tor included with the Noise Figure Measurement Personality. Go to
Mode Setup then select Uncertainty
Calculator
. Similar calculators are also available on the Agilent web site; go to http://www.agi-
lent.com/find/nfu.
≤10 MHz
b
b. Instrument Uncertainty is nominally the same in this frequency range as in the higher frequency range.
However, total uncertainty is higher because the analyzer has poorer noise figure, leading to higher
uncertainties as computed by the uncertainty calculator. Also, there is a paucity of available noise
sources in this range.
10 MHz to 3.6 GHz Using internal preamp
(Option P03) and
RBW = 4 MHz
Noise Source ENR Measurement
Range
Instrument
Uncertainty
cd
c. “Instrument Uncertainty” is defined for noise figure analysis as uncertainty due to relative amplitude
uncertainties encountered in the analyzer when making the measurements required for a noise figure
computation. The relative amplitude uncertainty depends on, but is not identical to, the relative display
scale fidelity, also known as incremental log fidelity. The uncertainty of the analyzer is multiplied
within the computation by an amount that depends on the Y factor to give the total uncertainty of the
noise figure or gain measurement.
See Agilent App Note 57-2, literature number 5952-3706E for details on the use of this specification.
Jitter (amplitude variations) will also affect the accuracy of results. The standard deviation of the mea-
sured result decreases by a factor of the square root of the Resolution Bandwidth used and by the
square root of the number of averages. This application uses the 4 MHz Resolution Bandwidth as
default since this is the widest bandwidth with uncompromised accuracy.
d. The instrument uncertainties shown are under best-case sweep time conditions, which is a sweep time
near to the period of the power line, such as 20 ms for 50 Hz power sources. The behavior can be
greatly degraded (uncertainty increased nominally by 0.12 dB) by setting the sweep time per point far
from an integer multiple of the period of the line frequency.
4 − 6.5 dB 0 to 20 dB ±0.02 dB
12 − 17 dB 0 to 30 dB ±0.025 dB
20 − 22 dB 0 to 35 dB ±0.03 dB
Above 3.6 GHz
Not Recommended
e