Agilent Technologies Z5623A Option H48 Multiport Test Set User’s and Service Guide Manufacturing Part Number: Z5623-90016 Printed in USA June 2005 © Copyright 2000-2002, 2005 Agilent Technologies, Inc. All rights reserved.
Warranty Statement THE MATERIAL CONTAINED IN THIS DOCUMENT IS PROVIDED “AS IS,” AND IS SUBJECT TO BEING CHANGED, WITHOUT NOTICE, IN FUTURE EDITIONS. FURTHER, TO THE MAXIMUM EXTENT PERMITTED BY APPLICABLE LAW, AGILENT DISCLAIMS ALL WARRANTIES, EITHER EXPRESS OR IMPLIED WITH REGARD TO THIS MANUAL AND ANY INFORMATION CONTAINED HEREIN, INCLUDING BUT NOT LIMITED TO THE IMPLIED WARRANTIES OF MERCHANTABILITY AND FITNESS FOR A PARTICULAR PURPOSE.
Safety Notes The following safety notes are used throughout this document. Familiarize yourself with each of these notes and its meaning before performing any of the procedures in this document. WARNING Warning denotes a hazard. It calls attention to a procedure which, if not correctly performed or adhered to, could result in injury or loss of life. Do not proceed beyond a warning note until the indicated conditions are fully understood and met. CAUTION Caution denotes a hazard.
iv
Contents 1. Instrument Description Overview . . . . . . . . . . . . . . . . . . . . . . . . . . . . . . . . . . . . . . . . . . . . . . . . . . . . . . 1-2 Specifications . . . . . . . . . . . . . . . . . . . . . . . . . . . . . . . . . . . . . . . . . . . . . . . . . . . 1-3 Guaranteed Performance. . . . . . . . . . . . . . . . . . . . . . . . . . . . . . . . . . . . . . . . . 1-4 Typical Performance. . . . . . . . . . . . . . . . . . . . . . . . . . . . . . . . . . . . . . . . . . . .
Malfunctioning Command Window . . . . . . . . . . . . . . . . . . . . . . . . . . . . . . . 3-13 Malfunctioning Network Analyzer. . . . . . . . . . . . . . . . . . . . . . . . . . . . . . . . 3-18 4. Calibrating the Network Analyzer Performing the Calibration . . . . . . . . . . . . . . . . . . . . . . . . . . . . . . . . . . . . . . . . . 4-2 Renaming the Calibration File . . . . . . . . . . . . . . . . . . . . . . . . . . . . . . . . . . . . . . 4-7 Recalling and Examining Calibrations. . . . . . . . . .
Contents Limit Testing for Crosstalk . . . . . . . . . . . . . . . . . . . . . . . . . . . . . . . . . . . . . 5-26 Specifying Output Power . . . . . . . . . . . . . . . . . . . . . . . . . . . . . . . . . . . . . 5-26 Specifying IF Bandwidth and Averaging . . . . . . . . . . . . . . . . . . . . . . . . . 5-28 Specifying Measurement Type, Title, and Scaling . . . . . . . . . . . . . . . . . . 5-32 Setting Up the Limit Table . . . . . . . . . . . . . . . . . . . . . . . . . . . . . . . . . . . .
Connector Replacement . . . . . . . . . . . . . . . . . . . . . . . . . . . . . . . . . . . . . . . . . 8-4 Troubleshooting . . . . . . . . . . . . . . . . . . . . . . . . . . . . . . . . . . . . . . . . . . . . . . . . . 8-5 General Troubleshooting Notes . . . . . . . . . . . . . . . . . . . . . . . . . . . . . . . . . . . 8-5 Troubleshooting Power Supply Problems . . . . . . . . . . . . . . . . . . . . . . . . . . . 8-5 Troubleshooting the Front Panel Board . . . . . . . . . . . . . . . . . . . . . . . .
1 Instrument Description This chapter contains the following sections: • Overview • Specifications • Electrical Requirements • Environmental Requirements • General Characteristics • Available Options • Cleaning and Shipping Instructions Agilent Technologies Z5623A Option H48 1-1
Instrument Description Overview Overview The Agilent Z5623A Option H48 Multiport Test Set is designed for use with 50 Ω Network Analyzers such as the Agilent PNA Series (Models E8356A, E8357A, and E8358A). Figure 1-1 shows a typical equipment setup. The test set reduces the time required to test multiport devices having up to eight ports (distribution amplifiers, taps, switches, couplers, etc.). It does this by reducing the number of device reconnects the operator must perform.
Instrument Description Specifications Specifications Agilent provides two different types of specifications for the test set: • Guaranteed performance specs • Typical performance specs Typical performance specs have been benchmarked during product development, but are not tested by the factory and are not guaranteed.
Instrument Description Specifications Guaranteed Performance Table 1-1 Agilent Z5623A Option H48 Guaranteed Performance Specs Parameter Specification Frequency Range 300 kHz to 9.0 GHz Crosstalka 1) –110 dBb 2) –105 dBc 3) –95 dBd 4) –90 dBe Return Loss (port active)f 1) 24 dBb 2) 18 dBc 3) 14 dBd 4) 9 dBe Return Loss (port off)g 1) 26 dBb 2) 20 dBc 3) 16 dBd 4) 14 dBe Insertion Lossh 1) 1.5 dBb 2) 2.0 dBc 3) 2.5 dBd 4) 3.
Instrument Description Specifications Typical Performance Table 1-2 Agilent Z5623A Option H48 Typical Performance Specs Parameter Typical Performance Source Power (max)a 1) –8.0 dBmb 2) –8.0 dBmc 3) –7.0 dBmd 4) –1.
Instrument Description Electrical Requirements Electrical Requirements The alternating-current (AC) power that is supplied to the test set must meet the following requirements: Voltage: 90 to 250 Vac Frequency: 48 to 66 Hz Available power: 40 watts minimum If the available AC line voltage is outside the 90 to 250 Vac range, an autotransformer that provides third wire continuity to earth ground may be used.
Instrument Description General Characteristics General Characteristics Weight Net: Approximately 9 kg Shipping: Approximately 20 kg Cabinet Dimensions These dimensions exclude front and rear panel protrusions. 89 mm H by 425 mm W by 500 mm D (3.5 in by 16.75 in by 19.7 in) Miscellaneous Characteristics RF connectors: Type N female Switch type: Mechanical I/O Control: GPIB Available Options UK6 Option UK6 provides a commercial calibration certificate including actual test data.
Instrument Description Cleaning and Shipping Instructions Cleaning and Shipping Instructions Cleaning Clean the instrument cabinet using a damp cloth only. Shipping Always transport or ship the instrument using the original packaging if possible. If not, comparable packaging must be used.
2 Installation This chapter contains the following sections: • Checking the Shipment • Recommended Additional Equipment • Familiarization with Safety Requirements • Electrical Preparations • Environmental Preparations • Test Set Familiarization • Setting the GPIB Address of the Test Set • Connecting and Turning on the Test Set Agilent Technologies Z5623A Option H48 2 -1
Installation Checking the Shipment Checking the Shipment After the test set has been unpacked, keep the original packaging materials so they can be used if you need to transport the instrument. Check the items received against Table 2-1 to make sure you have received everything. Inspect the test set and all accessories for any signs of damage that may have occurred during shipment. If your test set or any accessories appear to be damaged or missing, call Agilent Technologies.
Installation Recommended Additional Equipment Recommended Additional Equipment The equipment listed in Table 2-2 is not shipped with the test set, but is recommended for use with it. The remainder of this User’s and Service Guide assumes that the user has the listed equipment (or its equivalent) available. Table 2-2 Recommended Equipment Not Supplied With Test Set Description Model Or Part Number Quantity PNA Series Network Analyzer Agilent Model No.
Installation Familiarization with Safety Requirements Familiarization with Safety Requirements This document contains two types of safety notices: Warnings and Cautions. A Warning denotes a hazard that may endanger the operator. A Caution denotes a hazard that may endanger the instrument. Before proceeding to the Electrical Preparations described in the next section, turn to Chapter 9, “Safety and Regulatory Information,” and review the Warnings, Cautions, and safety markings that apply to this instrument.
Installation Electrical Preparations Figure 2-1 Protective Earth Ground WARNING This is a Safety Class I product (provided with a protective earthing ground incorporated in the power cord). The mains plug shall only be inserted into a socket outlet provided with a protective earth contact. Any interruption of the protective conductor, inside or outside the instrument, is likely to make the instrument dangerous. Intentional interruption of the protective conductor is prohibited.
Installation Electrical Preparations Figure 2-2 Power Cables a Plug Type 250V Cable Plug b Length Part Number Description cm (in.
Installation Environmental Preparations Environmental Preparations 1. Ensure that the “Environmental Requirements” on page 1-6 are met. 2. If you are installing the test set into a cabinet, ensure there are at least two inches of clearance around the sides and back of the test set and the system cabinet. See Figure 2-3. The convection into and out of the test set must not be restricted.
Installation Environmental Preparations 3. Set up a static safe workstation such as the one shown in Figure 2-4. Electrostatic discharge (ESD) can damage or destroy electronic components.
Installation Test Set Familiarization Test Set Familiarization This section familiarizes the user with various front and rear panel features of the test set. Front Panel Figure 2-5 Front Panel Features REFLECTION Port PORT CONNECTION Status LCD TRANSMISSION Port POWER ON Switch Test Ports 1 through 8 CONTROL LINES Connector GROUND Connector POWER ON Switch The POWER ON Switch turns the AC power to the test set on and off. The switch is located at the bottom left corner of the front panel.
Installation Test Set Familiarization The PORT CONNECTION Status LCD The PORT CONNECTION Status LCD displays the following: • Which test port is connected to the REFLECTION port • Which test port is connected to the TRANSMISSION port • The status (O = “Open”, L = “Low”) of each of the five control lines (C5 through C1) All test ports not displayed on the Status LCD are internally terminated in 50 Ω.
Installation Test Set Familiarization Rear Panel Figure 2-6 Rear Panel Features Not Used GPIB Connector GPIB Address Switches Line Module GPIB Connector This connector allows the test set to be controlled either by the network analyzer or by an external controller. GPIB Address Switches The GPIB Address Switches set the GPIB address of the test set. See “Setting the GPIB Address of the Test Set” on page 2-13 for information.
Installation Test Set Familiarization The Line Fuse The line fuse (F 3 A/250 V, part number 2110-0780) and a spare reside within the line module. Figure 2-7 illustrates where the fuses are and how to access them.
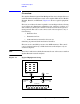
Installation Setting the GPIB Address of the Test Set Setting the GPIB Address of the Test Set A bank of five switches is used to set the GPIB address of the test set. The switch bank is located on the rear panel of the test set and is shown in Figure 2-6 on page 2-11. A diagram of the switch bank is presented in Figure 2-8. The switch bank sets the GPIB address in binary (base 2) format. Each switch controls one bit of the address. To set a bit to 1, move the corresponding switch to the up position.
Installation Connecting and Turning on the Test Set NOTE The test set is shipped from the factory with the GPIB address set to 12. Connecting and Turning on the Test Set Make the connections shown in Figure 2-9, “Detailed Equipment Connection Diagram.” The figure shows two RF cables connecting the network analyzer to the test set. If you intend to verify the performance of the test set, use the long RF cables listed in Table 2-3. Otherwise, use the short ones.
Installation Connecting and Turning on the Test Set Figure 2-9 Detailed Equipment Connection Diagram USB Quad Hub Port 1 Port 2 Port 3 Port 4 Up Link USB Cable Mouse with USB Cable Keyboard with USB Cable Network Analyzer To USB Port on Rear Panel To GPIB Connector on Rear Panel USB Port Port 2 Port 1 RF Cables GPIB Cable Z5623A Option H48 Reflection Port To GPIB Connector on Rear Panel Transmission Port Test Ports 1 2 3 4 5 6 7 8 USB Cable Electronic Calibration Module Agilent Technol
Installation Connecting and Turning on the Test Set 2 -16 Agilent Technologies Z5623A Option H48
3 Using the Network Analyzer to Control the Test Set This chapter assumes the following: • The instructions in Chapter 2 , “Installation,” have been performed. • The test set and associated equipment are connected as shown in Figure 2-9 on page 2-15. This chapter shows you how the network analyzer can be used to manually control the test set. The method presented here is considered a manual one because the user manually enters individual commands on a keyboard connected to the network analyzer.
Using the Network Analyzer to Control the Test Set Preparing the Analyzer to Control the Test Set Preparing the Analyzer to Control the Test Set Step 1. Make sure that all connections shown in Figure 2-9 on page 2-15 have been made. Step 2. Make sure that both the PNA Series analyzer and the test set are turned on. Step 3. On the network analyzer, click the System menu, scroll down to Configure, and click SICL/GPIB. See Figure 3-1, “System Menu.
Using the Network Analyzer to Control the Test Set Preparing the Analyzer to Control the Test Set Step 4. In the SICL/GPIB window, click System Controller and then OK. See Figure 3-2, “SICL/GPIB Window.” Figure 3-2 SICL/GPIB Window Step 5. Locate the Minimize button (“_”) in the top right corner of the window. See the upper right-hand corner of Figure 3-2. See also the magnified view shown in Figure 3-3, “Minimize Window.
Using the Network Analyzer to Control the Test Set Preparing the Analyzer to Control the Test Set Step 6. On the desktop, double-click the Measurement & Automation icon. See Figure 3-4, “PNA DeskTop.” Figure 3-4 PNA DeskTop Step 7. From the Measurement & Automation window, click on the Devices and Interfaces folder to expand the directory. Step 8. Right-click GPIBO (AT-GPIB/TNT), then click Interactive Control. See Figure 3-5, “Interactive Control window.
Using the Network Analyzer to Control the Test Set Preparing the Analyzer to Control the Test Set Step 9. When the C:\Progam Files\National Instruments\ NI-488.2\ bin\ibic.exe window appears, type ibdev. See Figure 3-6, “User Controller Window.”. Then you will be prompted to: Enter Enter Enter Enter Enter Enter Figure 3-6 board index: “0” primary address: “12” secondary address: “0” timeout: “0” ‘EOI on last byte’ flag: “0” end-of-string byte/mode: “1” User Controller Window Step 10.
Using the Network Analyzer to Control the Test Set Preparing the Analyzer to Control the Test Set Step 12. Use the mouse to size and position the PNA Series Network Analyzer window and the command window (C:\Progam Files\National Instruments \NI-488.2\bin\ibic.exe) so that both windows are visible on the network analyzer screen. See Figure 3-7, “Manual Control Window.
Using the Network Analyzer to Control the Test Set How to Send a Manual Command How to Send a Manual Command This procedure assumes the following: • The instructions in the previous section (“Preparing the Analyzer to Control the Test Set”) have been performed. • The command window (C:\Program Files\ National Instruments\NI-488.2\bin\ibic.exe) shown at the bottom of Figure 3-7 is visible on the analyzer. Step 1. Select a command from Table 3-2 or Table 3-3. Step 2.
Using the Network Analyzer to Control the Test Set Common Errors in Manual Commands NOTE It is possible to issue several commands in a single line. For example, the following string connects the Reflection port to Test Port #2, connects the Transmission port to Test Port #5, and sets the Control Lines to OLOOL: “refl_02;tran_05;00001001;”. Common Errors in Manual Commands This section explains several common errors.
Using the Network Analyzer to Control the Test Set A List of GPIB Commands A List of GPIB Commands Table 3-2 Test Port Commands Connection Path Reflection to Port 1 refl_01 Reflection to Port 2 refl_02 Reflection to Port 3 refl_03 Reflection to Port 4 refl_04 Reflection to Port 5 refl_05 Reflection to Port 6 refl_06 Reflection to Port 7 refl_07 Reflection to Port 8 refl_08 Transmission to Port 1 tran_01 Transmission to Port 2 tran_02 Transmission to Port 3 tran_03 Transmission to Por
Using the Network Analyzer to Control the Test Set A List of GPIB Commands Table 3-3 Control Line Commands Resulting Control Line Statesa (C5, C4, C3, C2, C1) GPIB Command Mnemonic 3-10 Decimal Binary c1_on xxxxL c1_off xxxxO c2_on xxxLx c2_off xxxOx c3_on xxLxx c3_off xxOxx c4_on xLxxx c4_off xOxxx c5_on Lxxxx c5_off Oxxxx 0 00000000 OOOOO 1 00000001 OOOOL 2 00000010 OOOLO 3 00000011 OOOLL 4 00000100 OOLOO 5 00000101 OOLOL 6 00000110 OOLLO 7 00000111 OOLLL
Using the Network Analyzer to Control the Test Set A List of GPIB Commands Table 3-3 Control Line Commands Resulting Control Line Statesa (C5, C4, C3, C2, C1) GPIB Command Mnemonic Decimal Binary 17 00010001 LOOOL 18 00010010 LOOLO 19 00010011 LOOLL 20 00010100 LOLOO 21 00010101 LOLOL 22 00010110 LOLLO 23 00010111 LOLLL 24 00011000 LLOOO 25 00011001 LLOOL 26 00011010 LLOLO 27 00011011 LLOLL 28 00011100 LLLOO 29 00011101 LLLOL 30 00011110 LLLLO 31 00011111 L
Using the Network Analyzer to Control the Test Set Restoring the Analyzer to its Normal Configuration Restoring the Analyzer to its Normal Configuration It is a good idea to restore the analyzer to its normal configuration once you are finished using the analyzer to control the test set. To accomplish this, use the following procedure: Step 1. Type q in the command window, then press the key. This terminates the interactive control session on the analyzer. Step 2.
Using the Network Analyzer to Control the Test Set Disaster Recovery Disaster Recovery This section provides recovery procedures for the following problems: • Malfunctioning Command Window • Malfunctioning Network Analyzer Malfunctioning Command Window Symptoms Any of the following symptoms indicates a malfunctioning command window. • No ud0: prompt is returned when the ibclr command is executed. • An error message is returned when the ibdev command is properly executed.
Using the Network Analyzer to Control the Test Set Disaster Recovery Figure 3-8 Network Analyzer Screen With Four Applications Running Four applications running Figure 3-9 Network Analyzer Screen With No Applications Running No applications running 3-14 Agilent Technologies Z5623A Option H48
Using the Network Analyzer to Control the Test Set Disaster Recovery Step 2. Right-click on the “My Computer” icon on the network analyzer screen. A drop-down menu will appear as shown in Figure 3-10. Figure 3-10 Analyzer Screen After Right-Click On “My Computer” Icon Step 3. Click Properties in the drop-down menu. A “System Properties” window will appear as shown in Figure 3-11.
Using the Network Analyzer to Control the Test Set Disaster Recovery Step 4. Click the Hardware tab shown in Figure 3-11. The result is shown in Figure 3-12. Figure 3-12 “Hardware” Tab In “System Properties” Window Click this button. Step 5. Click the Device Manager button. After you do so, there will be a 10-second delay before the “Device Manager” window appears. This window is shown in Figure 3-13 and Figure 3-14. Step 6. Check to see if the “AT-GPIB/TNT” icon is visible as shown in Figure 3-14.
Using the Network Analyzer to Control the Test Set Disaster Recovery Figure 3-13 Device Manager Window Figure 3-14 Device Manager Window With “AT-GPIB/TNT” Icon Visible Step 7. Right-click on the “AT-GPIB/TNT” icon. A menu will pop up. Step 8. Click Disable on the menu. Step 9. The following message will pop up: “Disabling this device will cause it to stop functioning. Do you really want to disable it?” Click “Yes.” See Figure 3-15.
Using the Network Analyzer to Control the Test Set Disaster Recovery Figure 3-15 GPIB Device Disabling Message Step 10. Right-click on the “AT-GPIB/TNT” icon once again. A menu will pop up. Step 11. Click Enable on the menu. Step 12. Close the Device Manager window by clicking on the X in the upper right-hand corner of the window. Step 13. Close the System Properties window by clicking on the X in the upper right-hand corner of the window. The recovery procedure is now complete.
4 Calibrating the Network Analyzer This chapter shows you how to calibrate the network analyzer so that it can be used to verify the performance of the test set. The calibration technique presented in this chapter uses an Electronic Calibration (ECal) Module and is by far the easiest of all 2-port calibration techniques. Consult the Help facility built into the PNA Series Network Analyzer for a comprehensive tutorial on this calibration method and on many others.
Calibrating the Network Analyzer Performing the Calibration Performing the Calibration Step 1. Make the connections shown in Figure 4-1. The figure shows two RF cables connecting the two ports of the network analyzer to the two ports of the ECal Module. The 24” RF cables (Agilent Part No. 8120-4781 or equivalent) listed in Table 2-2 on page 2-3 should be used. Make sure the connectors are snugly tightened but not overtorqued. A torque wrench set to 12 inch-pounds (Agilent Part No.
Calibrating the Network Analyzer Performing the Calibration Step 2. Press the Preset button on the Network Analyzer. Step 3. Verify that the Ready light on the ECal Module is green. Step 4. On the network analyzer, click Calibration on the menu bar, then click the Calibration Wizard button. See Figure 4-2. Figure 4-2 Calibration Menu on Network Analyzer Step 5. When the window shown in Figure 4-3 comes up, click the Cal Type button. The Cal Type window shown in Figure 4-4 will then pop up.
Calibrating the Network Analyzer Performing the Calibration Figure 4-4 Cal Type Window When It Is First Opened Step 6. Click the Full SOLT 2-Port button. The result is shown in Figure 4-5. Figure 4-5 Cal Type Window After Selecting “Full SOLT 2-Port” Step 7. Click the OK button. The Cal Type window will then close and the Cal Wizard window will pop back up as shown in Figure 4-6. Figure 4-6 Cal Wizard Menu After Selection Of Cal Type Is Complete Step 8.
Calibrating the Network Analyzer Performing the Calibration Figure 4-7 Electronic Calibration Window Step 10. Click the Module button. The window shown in Figure 4-8 will then pop up. Figure 4-8 Module Connection Message Step 11. Click the OK button. (The connections requested in Figure 4-8 were made in Step 1 of “Performing the Calibration” on page 4-2.) This window will close, the window shown in Figure 4-7 will pop back up, and the calibration will begin.
Calibrating the Network Analyzer Performing the Calibration Or repeat your cal.” Figure 4-10 Cal Wizard Window After Cal Is Complete Step 14. Get a pen or pencil and a piece of paper. Step 16 will ask you to write down a filename. Step 15. Click the OK button. The calibration will now be saved to disk in the following directory: C:\Program Files\Agilent\Network Analyzer\Documents. The file will have a “.cst” suffix. Step 16. Copy down the name of the file into which the calibration is saved.
Calibrating the Network Analyzer Renaming the Calibration File Renaming the Calibration File In this section you will rename the calibration file to make it easier to identify and retrieve. Step 1. Minimize the network analyzer window. (If you are not sure how to do this, refer to Step 5 of “Preparing the Analyzer to Control the Test Set” on page 3-2.) Step 2. Double-click the “My Computer” icon on the network analyzer display. This icon can be seen in the upper left-hand corner of Figure 3-8 on page 3-14.
Calibrating the Network Analyzer Renaming the Calibration File Step 4. The window shown in Figure 4-12 will pop up. Click the “Program Files” icon. Figure 4-12 Root Directory of the C: Drive Step 5. The window shown in Figure 4-13 will pop up. Click the “Agilent” icon.
Calibrating the Network Analyzer Renaming the Calibration File Step 6. The window shown in Figure 4-14 will pop up. Click the “Network Analyzer” icon. Figure 4-14 “C:\Program Files\Agilent” Directory Step 7. The window shown in Figure 4-15 will pop up. Click the “Documents” icon.
Calibrating the Network Analyzer Renaming the Calibration File Step 8. The window shown in Figure 4-16 will pop up. It contains all of the calibration files. Click the Type button above the files so that they will be listed by file type. The result is shown in Figure 4-17.
Calibrating the Network Analyzer Renaming the Calibration File Step 9. Move the cursor over the filename that was copied down in Step 16 of “Performing the Calibration” on page 4-6. (If you were not able to copy down the filename, select the “.cst” file whose date and time correspond to when you completed the calibration.) Do not click the filename you have selected. Just keep the cursor positioned over the filename for about two seconds (until it is highlighted as shown in Figure 4-18).
Calibrating the Network Analyzer Renaming the Calibration File Step 11. Click File on the menu bar, then scroll down and click the Rename button as shown in Figure 4-19.
Calibrating the Network Analyzer Renaming the Calibration File Step 12. Give the file a new name that includes the following: • The date the cal was performed • The suffix “.cst” For example, if the calibration was performed on 6/17/01, a filename of “cal_06_17_01.cst” would be appropriate. See Figure 4-20. Figure 4-20 The Cal File After It Has Been Renamed Step 13. Record the new name of the calibration file in Table 4-1. The file must have a suffix of “.cst”. Table 4-1 Name of Calibration File .
Calibrating the Network Analyzer Recalling and Examining Calibrations Recalling and Examining Calibrations This section contains the following subsections: • How to Recall a Calibration • How to Turn a Calibration On and Off • How to Examine the Properties of a Calibration How to Recall a Calibration There are two methods of recalling a calibration. The first and more general method is used when the calibration file is not on the “quick recall” list that appears whenever File is clicked on the menu bar.
Calibrating the Network Analyzer Recalling and Examining Calibrations Step 2. The Recall window shown in Figure 4-22 will pop up. Move the horizontal scroll box until the desired calibration file is visible, then click on it. The window will momentarily appear as shown in Figure 4-23. The file will then be recalled and the window will close.
Calibrating the Network Analyzer Recalling and Examining Calibrations Method 2. Calibration File Is On “Quick Recall” List Click File on the menu bar, then scroll down to the desired calibration file and click it. See Figure 4-24. The file will immediately be recalled. Figure 4-24 Recalling a Calibration File That Is On the “Quick Recall” List How to Turn a Calibration On and Off Click Calibration on the menu bar, then scroll down to the Correction On/Off button.
Calibrating the Network Analyzer Recalling and Examining Calibrations Figure 4-25 Calibration Turned On Figure 4-26 Calibration Turned Off Agilent Technologies Z5623A Option H48 4-17
Calibrating the Network Analyzer Recalling and Examining Calibrations How to Examine the Properties of a Calibration Step 1. Click Calibration on the menu bar, then scroll down to the Properties button and click it. See Figure 4-27. Figure 4-27 Calibration Properties Button Step 2. The window shown in Figure 4-28 will pop up. Examine it carefully.
5 Performance Verification This chapter contains the following sections: • Setting Test Limits • Test Strategy — Insertion Loss — Return Loss — Crosstalk • Setting Up Limit Testing — Limit Testing for Insertion Loss — Limit Testing for Return Loss (Port Active) — Limit Testing for Return Loss (Port Off) — Limit Testing for Crosstalk • Verifying Return Loss and Insertion Loss Specifications • Verifying Crosstalk Specs Agilent Technologies Z5623A Option H48 5 -1
Performance Verification Setting Test Limits Setting Test Limits A test limit is the pass/fail criterion for a measurement. A test limit can be either a maximum limit or a minimum limit. With a maximum limit, the measurement must not go above the limit in order for the Device Under Test (DUT) to pass. With a minimum limit, the measurement must not go below the limit in order for the DUT to pass.
Performance Verification Setting Test Limits Applying Equation 5-1 to the uncertainties listed in Table 5-1 and to the guaranteed specifications listed in Table 1-1 on page 1-4, we obtain the test limits in Table 5-2: Table 5-2 Derivation of Test Limits for Performance Verification of Test Set Parameter Specification Measurement Uncertainty Test Limit Crosstalka,b 1) –110 dBc 2) –105 dBd 3) –95 dBe 4) –90 dBf 1) 5 dBc 2) 5 dBd 3) 5 dBe 4) 7 dBf 1) –115 dBc 2) –110 dBd 3) –100 dBe 4) –97 dBf Return
Performance Verification Test Strategy Test Strategy The overall test strategy of this chapter is to verify each guaranteed specification by means of a limit test that is stored and recalled on the network analyzer. This strategy minimizes the number of cable connections and the amount of time required to complete the performance verification. It also minimizes the likelihood of operator error.
Performance Verification Test Strategy Insertion Loss For this measurement, Port 1 of the network analyzer will be connected to one of the test ports of the test set, and Port 2 of the network analyzer will be connected either to the Reflection port or to the Transmission port of the test set. By definition, Insertion Loss = − S21 where Insertion Loss and S21 are both in units of dB. The network analyzer will be configured to measure S21.
Performance Verification Test Strategy Return loss is specified for two different conditions: • Test port active (this means that the test port is internally connected either to the Reflection port or to the Transmission port) • Test port off (this means that the test port is internally connected to a 50-ohm termination) Return loss is specified for the test ports, but not for the Reflection and Transmission ports.
Performance Verification Setting Up Limit Testing Setting Up Limit Testing In this section, you will create the limit test files described in “Test Strategy” on page 5-4. As you work through this section, record the names of the files you create in Table 5-3.
Performance Verification Setting Up Limit Testing Limit Testing for Insertion Loss Recalling the Calibration Recall the calibration file listed in Table 4-1 on page 4-13. (Consult “How to Recall a Calibration” on page 4-14.) Specifying Measurement Type, Title, and Scaling Step 1. Click Trace on the menu bar. When the Trace menu appears, scroll down to the Measure button and pause momentarily. When the Measure menu appears, scroll down to the S21 button and click it. See Figure 5-1.
Performance Verification Setting Up Limit Testing Step 2. Click View on the menu bar. When the View menu appears, scroll down to the Meas Display button and pause momentarily. When the Meas Display menu appears, scroll down to the Title... button and click it. See Figure 5-2. Figure 5-2 The “Title...” Button Step 3. The Title Entry window is shown in Figure 5-3. When this window pops up, use the mouse to click anywhere in the white rectangle to the right of the word, “Entry:”.
Performance Verification Setting Up Limit Testing Step 4. Type “Insertion Loss” in the Entry field as shown in Figure 5-4. You can do this with the keyboard shown in the Title Entry window if you want, but an easier way is to use the USB keyboard shown in Figure 2-9 on page 2-15. After typing “Insertion Loss”, press the Enter key on the USB keyboard (or the OK button in the Title Entry window) to close the window and display the new title.
Performance Verification Setting Up Limit Testing Step 6. The Scale window shown in Figure 5-6 will pop up. When it does, set the following values: • Scale Per Division = 1 dB • Reference Level = 0 dB • Reference Position = 9 Divisions When these values have been entered, the Scale window will look like Figure 5-7. Click the OK button.
Performance Verification Setting Up Limit Testing Setting Up the Limit Table Step 1. Click Trace on the menu bar. When the Trace menu appears, scroll down to the Limit Test... button and click it. See Figure 5-8. Figure 5-8 The “Limit Test...” Button Step 2. When the Limit Test window pops up as shown in Figure 5-9, click the Show Table button, then click the OK button. Figure 5-9 The “Limit Test” Window Step 3.
Performance Verification Setting Up Limit Testing Shortcuts: a. To specify a Segment Type, click the Segment Type box in the desired row, then use the drop-down menu. b. To specify a Beginning Stimulus or an Ending Stimulus, click the respective box in the desired row, then enter the desired value followed by “k” if the value is in kilohertz, or by “g” if the value is in gigahertz. For example, to specify a Beginning Stimulus of 300 kHz, type, “300k” (without the quotation marks).
Performance Verification Setting Up Limit Testing Turning On Limit Lines and Limit Testing Step 1. Click Trace on the menu bar. When the Trace menu appears, scroll down to the Limit Test... button and click it as shown in Figure 5-8. The Limit Test window shown in Figure 5-9 will pop up. Step 2. Click the Limit Test ON and Limit Line ON boxes. The result is shown in Figure 5-12. Figure 5-12 Turning On Limit Testing and Limit Line Display Step 3. Click the Hide Table button, then click the OK button.
Performance Verification Setting Up Limit Testing Figure 5-13 Insertion Loss Limit Test Being Run On ECal Module Saving the Limit Test File Step 1. Click File on the menu bar. When the File menu appears, scroll down to the Save As... button and click it. See Figure 5-14. Figure 5-14 “Save As...
Performance Verification Setting Up Limit Testing Step 2. When the Save As window comes up as shown in Figure 5-15, type a file name that includes the words, “insertion loss,” and the date of the calibration listed in Table 4-1 on page 4-13. For example, if the calibration file is named, “cal_06_17_01”, an appropriate file name for this step would be, “insertion_loss_with_06_17_01_cal”. See Figure 5-16. After entering the file name, record it in Table 5-3 on page 5-7. Next, click the Save button.
Performance Verification Setting Up Limit Testing Checking the Limit Test File Step 1. Connect an RF cable from Port 1 of the network analyzer to Test Port 1 of the test set. Connect an RF cable from Port 2 of the network analyzer to the Reflection Port of the test set. Step 2. If the test set is turned off, turn it on. If the test set is already turned on, turn it off, then back on again.
Performance Verification Setting Up Limit Testing Step 4. Recall the limit line file for insertion loss. The file name should be listed in Table 5-3 on page 5-7. The resulting display should look something like Figure 5-18.
Performance Verification Setting Up Limit Testing Limit Testing for Return Loss (Port Active) Recalling the Calibration Recall the calibration file listed in Table 4-1 on page 4-13. (Consult “How to Recall a Calibration” on page 4-14.) Specifying Measurement Type, Title, and Scaling The desired measurement type for the Return Loss test is S11. The network analyzer is already configured to measure S11. Step 1. Click View on the menu bar.
Performance Verification Setting Up Limit Testing Step 5. The Scale window shown in Figure 5-6 will pop up. When it does, set the following values: • Scale Per Division = 5 dB • Reference Level = 0 dB • Reference Position = 9 Divisions When these values have been entered, the Scale window will look like Figure 5-20. Click the OK button. Figure 5-20 The Scale Window With Desired Values For Return Loss Setting Up the Limit Table Step 1. Click Trace on the menu bar.
Performance Verification Setting Up Limit Testing Figure 5-21 Completed Limit Table for Return Loss (Port Active) Turning On Limit Lines and Limit Testing Step 1. Click Trace on the menu bar. When the Trace menu appears, scroll down to the Limit Test... button and click it as shown in Figure 5-8. The Limit Test window shown in Figure 5-9 will pop up. Step 2. Click the Limit Test ON and Limit Line ON boxes. The result is shown in Figure 5-12. Step 3. Click the Hide Table button, then click the OK button.
Performance Verification Setting Up Limit Testing Saving the Limit Test File Step 1. Click File on the menu bar. When the File menu appears, scroll down to the Save As... button and click it. See Figure 5-14. Step 2. When the Save As window comes up as shown in Figure 5-15, type a file name that includes the words, “return loss,” the words, “port active”, and the date of the calibration listed in Table 4-1 on page 4-13.
Performance Verification Setting Up Limit Testing Step 4. Recall the limit line file for return loss (port active). The file name should be listed in Table 5-3 on page 5-7. The resulting display should look something like Figure 5-23.
Performance Verification Setting Up Limit Testing Limit Testing for Return Loss (Port Off) The limit test for return loss (port off) is identical to the limit test for return loss (port active) with the following exceptions: • The title • The limit table Recalling the “Port Active” Limit Test File Recall the limit test file for return loss (port active). It should be recorded in Table 5-3 on page 5-7. Specifying the Title Step 1. Click View on the menu bar.
Performance Verification Setting Up Limit Testing Figure 5-24 Completed Limit Table for Return Loss (Port Off) Step 4. Click Trace on the menu bar. When the Trace menu appears, scroll down to the Limit Test... button and click it as shown in Figure 5-8. The Limit Test window shown in Figure 5-9 will pop up. Step 5. Click the Hide Table button, then click the OK button. Saving the Limit Test File Step 1. Click File on the menu bar. When the File menu appears, scroll down to the Save As...
Performance Verification Setting Up Limit Testing Limit Testing for Crosstalk Specifying Output Power Step 1. Press the Preset button. Step 2. Click Channel on the menu bar. When the Channel menu appears, scroll down to the Power... button and click it. See Figure 5-25. Figure 5-25 The “Power...
Performance Verification Setting Up Limit Testing Step 3. The Power window shown in Figure 5-26 will pop up. Set the Test Port Power to +10 dBm as shown in Figure 5-27. Click the OK button in the Power window.
Performance Verification Setting Up Limit Testing Specifying IF Bandwidth and Averaging Step 1. Click Sweep on the menu bar. When the Sweep menu appears, scroll down to the IF Bandwidth... button and click it. See Figure 5-28. Figure 5-28 The “IF Bandwidth...” Button Step 2. When the IF Bandwidth window pops up as shown in Figure 5-29, change the IF Bandwidth to 100Hz. (Type, “100”, without the quotation marks.) The result is shown in Figure 5-30. Click the OK button.
Performance Verification Setting Up Limit Testing Figure 5-30 IF Bandwidth Window with Value Desired for Crosstalk Step 3. Click Channel on the menu bar. When the Channel menu appears, scroll down to the Average... button and click on it. See Figure 5-31. Figure 5-31 The “Average...
Performance Verification Setting Up Limit Testing Step 4. When the Average window shown in Figure 5-32 appears, click the Average ON box. Next, change the Average Factor to 10. (It is best to change the Average Factor by using the up arrow.) The results are shown in Figure 5-33. Click the OK button.
Performance Verification Setting Up Limit Testing Step 5. Click View on the menu bar. When the View menu appears, scroll down to the Status Bar button and click it as shown in Figure 5-34. The status bar will appear at the bottom of the screen as shown in Figure 5-35.
Performance Verification Setting Up Limit Testing Figure 5-35 The Status Bar Displayed at Bottom of Screen Specifying Measurement Type, Title, and Scaling Step 1. Click Trace on the menu bar. When the Trace menu appears, scroll down to the Measure button and pause momentarily. When the Measure menu appears, scroll down to the S21 button and click it. See Figure 5-1. Step 2. Click View on the menu bar. When the View menu appears, scroll down to the Meas Display button and pause momentarily.
Performance Verification Setting Up Limit Testing Figure 5-36 The “Scale...” Button Step 6. The Scale window shown in Figure 5-6 will pop up. When it does, set the following values: • Scale Per Division = 20 dB • Reference Level = 0 dB • Reference Position = 9 Divisions When these values have been entered, the Scale window will look like Figure 5-37. Click the OK button.
Performance Verification Setting Up Limit Testing Figure 5-37 The Scale Window With Desired Values For Crosstalk Setting Up the Limit Table Step 1. Click Trace on the menu bar. When the Trace menu appears, scroll down to the Limit Test... button and click it. See Figure 5-8. Step 2. When the Limit Test window pops up as shown in Figure 5-9, click the Show Table button, then click the OK button. Step 3.
Performance Verification Setting Up Limit Testing Turning On Limit Lines and Limit Testing Step 1. Click Trace on the menu bar. When the Trace menu appears, scroll down to the Limit Test... button and click it as shown in Figure 5-8. The Limit Test window shown in Figure 5-9 will pop up. Step 2. Click the Limit Test ON and Limit Line ON boxes. The result is shown in Figure 5-12. Step 3. Click the Hide Table button, then click the OK button. Saving the Limit Test File Step 1. Click File on the menu bar.
Performance Verification Verifying Return Loss and Insertion Loss Specifications Verifying Return Loss and Insertion Loss Specifications Measurements Using The Reflection Port Step 1. Connect an RF cable from Port 1 of the network analyzer to Test Port 1 of the test set. Connect another RF cable from Port 2 of the network analyzer to the Reflection Port of the test set. See Figure 5-39. Figure 5-39 Setup for Measuring Insertion Loss and Return Loss of Test Set E8358A (300 kHz - 9.
Performance Verification Verifying Return Loss and Insertion Loss Specifications Step 7. Command the test set to terminate all of its test ports. Step 8. Recall the limit test file for return loss (port off). It is listed in Table 5-3 on page 5-7. Step 9. Read the results of the return loss (port off) test on the screen of the network analyzer. Record the results in Table 5-8. Step 10. Move the RF cable to the next test port. Repeat Step 2 through Step 9. Step 11.
Performance Verification Verifying Return Loss and Insertion Loss Specifications Table 5-8 Pass/Fail Test Results For Insertion Loss And Return Loss Test Port Connected To Reflection Port Insertion Loss Internally Terminated Return Loss (Port Active) Return Loss (Port Off) Connected To Transmission Port Insertion Loss Return Loss (Port Active) 1 2 3 4 5 6 7 8 5 -38 Agilent Technologies Z5623A Option H48
Performance Verification Verifying Crosstalk Specs Verifying Crosstalk Specs Crosstalk need only be measured on adjacent ports. Two 50 Ω shorts are required for this test. Step 1. Connect an RF cable from Port 1 of the network analyzer to the Reflection Port of the test set. Connect another RF cable from Port 2 of the network analyzer to the Transmission Port of the test set. Connect a third RF cable from Test Port 1 to Test Port 8. See Figure 5-40.
Performance Verification Verifying Crosstalk Specs Step 9. Move the shorts to the next pair of test ports. (Only one short actually needs to be moved.) Repeat Step 7 and Step 8. Step 10. Repeat Step 9 until all seven adjacent pairs of test ports have been measured.
6 Measuring Multiport Devices Agilent Technologies Z5623A Option H48 6 -1
Measuring Multiport Devices Calibrating the Test System Calibrating the Test System After the test set has warmed up for at least two hours, you must calibrate the instrument before making any measurements. To determine the type of calibration appropriate for the measurements you will be making, refer to the PNA Series Network Analyzers User Guide, part number E8356-90001. You will need to calibrate each measurement path separately and store the calibration as an instrument state in the network analyzer.
Measuring Multiport Devices Calibrating the Test System Figure 6-1 Calibrating the Test System E8358A (300 kHz - 9.0 GHz) GPIB Port 1 Port 2 Reflection GPIB 1 Transmission 2 3 4 5 6 7 8 Calibration Paths A Input B Calibration and Test For the best accuracy, you should perform a full two-port calibration between ports 1 and 3 on the test set, and again between ports 1 and 5. As mentioned before, you need to save the calibrations as instrument states.
Measuring Multiport Devices Calibrating the Test System 6 -4 Agilent Technologies Z5623A Option H48
7 Advanced Topics This chapter contains the following sections: • Using an External Computer to Control the Test Set • Using the Control Lines Connector Agilent Technologies Z5623A Option H48 7 -1
Advanced Topics Using an External Computer to Control the Test Set Using an External Computer to Control the Test Set Chapters 3 through 6 assume that the network analyzer is being used to control the test set. If desired, an external computer can be used instead. In order to do this, a GPIB cable needs to be connected between the computer and the network analyzer. There is no need to connect a GPIB cable between the test set and the network analyzer in this case.
Advanced Topics Using an External Computer to Control the Test Set Box Identification To read the Box Identification, first query the test set for its ID, then read back the ID from the test set. For example, if the GPIB address of the test set is 12, send the following commands: OUTPUT 712;"id?" ENTER 712;Box_id$ Switch Count The Switch Count is the number of times a switch has been operated. To read the Switch Count for a particular switch, first query the switch and then read back the count.
Advanced Topics Using an External Computer to Control the Test Set Write Commands: info$=“refl_01” ‘command for reflection to port 1 length%=len(info$) ‘length of command HpibEoi(hHpib;7,0) 'disable EOI HpibEol(hHpib;7,””,0) 'disable EOL HpibOutputs (hHpib;712,info$,length%)) 'send command to test set HpibEol(hHpib;7,chr$(13)+chr$(10),2) 're-enable EOL and set to chr$(13)+chr$(10) HpibEoi(hHpib;7,1,) 're-enable EOI hHpib specifies the handle returned byHpibOpen.
Advanced Topics Using an External Computer to Control the Test Set Using National Instruments VISA If you are using National Instruments VISA, be sure to set the following variables as follows: VI_ATTR_SEND_END = VI_FALSE ‘ This specifies whether to assert END during the transfer of the last byte of the buffer VI_ATTR_TERMCHAR = 0x0A ‘ This is the termination character. When the termination character is read and VI_ATTR_TERMCHAR_EN is enabled during a read operation, the read operation terminates.
Advanced Topics Using the Control Lines Connector Using the Control Lines Connector The Control Lines connector allows the test set to control other equipment. See Figure 7-1, “Control Lines,” on page 7-7 for a diagram of the connector. The diagram identifies the ground pin and the pin that is associated with each of the five control lines (C1 through C5). (Notice that the connector has three unused pins.) The connector is driven by open-collector output drivers within the test set.
Advanced Topics Using the Control Lines Connector Figure 7-1 Control Lines C3 C2 C4 C1 C5 5 1 9 6 Ground Suggested External Circuitry Figure 7-2 shows one possible set of external circuitry for use with the Control Lines connector. The integrated circuit (IC) shown in the figure is a quad single-pole-single-throw (SPST) CMOS analog switch (Temic/Siliconix Part No. DG413). The IC contains two normally open and two normally closed switches.
Advanced Topics Using the Control Lines Connector Figure 7-2 Switch Driver Circuit For Use With Control Lines Connector +15 V 10 kΩ 12 13 3 C1_in (from Control Line Connector on Test Set) 1 VC (from Power Supply) C1_out (to DUT) 2 14 10 V 16 15 11 9 10 6 8 7 5 4 Temic/Siliconix DG413 -15 V 7 -8 Agilent Technologies Z5623A Option H48
Advanced Topics Using the Control Lines Connector The DUT may require a control voltage that is different from any of the existing power supply voltages. Rather than adding another power supply, a circuit such as the one shown in Figure 7-3 can be used to derive the needed voltage from one of the existing power supply outputs. The IC shown in the figure is a 3-Terminal Adjustable Voltage Regulator (National Semiconductor Part No. LM317). It can supply a maximum output current of 1.
Advanced Topics Using the Control Lines Connector 7 -10 Agilent Technologies Z5623A Option H48
8 Service This chapter contains the following sections: • Adjustments • Theory of Operation • Troubleshooting • List of Replaceable Parts Agilent Technologies Z5623A Option H48 8 -1
Service Adjustments Adjustments There are no adjustments for the test set.
Service Theory of Operation Theory of Operation The theory of operation begins with a general description of the test set. This is followed by more detailed operating theory. The operation of each group is described briefly, to the assembly level only. Detailed component-level circuit theory is not provided. System Theory Refer to Figure 8-1 on page 8-2. The test set consists of three main components: a power supply, front panel display, and main switch board.
Service Theory of Operation A2 Controller and A3 Switch Driver Board Theory The mother and daughter boards provide the bias for the switching paths for the various ports to the Reflection or Transmission ports. The front panel display contains an LCD that indicates the switched ports. A particular test port (1 through 8) can be in one of three states.
Service Troubleshooting Troubleshooting This section contains procedures for troubleshooting the test set to assembly level only. These procedures should enable you to determine whether the power supply, front panel, or main switch board needs replacing. Refer to the system block diagram (Figure 8-1 on page 8-2) as an aid in troubleshooting. General Troubleshooting Notes WARNING Always turn the instrument power off before removing or installing an assembly.
Service Troubleshooting Troubleshooting the Front Panel Board Turn the instrument power on and check the following: • Check the condition of each of the switching paths by issuing commands to switch each of the paths to either the transmission or reflection path. Ensure that the LCD indicates the appropriate path. • If the LCD indicates a wrong path, the problem can lie with either the front panel board or the main switch board. Measure the RF path to determine where the problem is.
Service List of Replaceable Parts List of Replaceable Parts The following table contains the list of replaceable parts for the test set. If any of these parts or assemblies is replaced, you must perform all performance tests to verify conformance to specifications. Table 8-1 Replaceable Parts for Z5623A Option H48 Reference Designator Description Part Number Quantity A1 24 Volt Power Supply 0950-2252 1 A4 2x16 LCD 2090-0370 1 Sw50-Sw57 1P2T Switch 26.
Service List of Replaceable Parts Table 8-1 Replaceable Parts for Z5623A Option H48 Reference Designator Description Part Number Quantity W15 RF Cable Z5623-20039 1 W16 RF Cable Z5623-20040 1 W17 RF Cable Z5623-20041 1 W18 RF Cable Z5623-20042 1 W19 RF Cable Z5623-20043 1 W20 RF Cable Z5623-20044 1 W21 RF Cable Z5623-20045 1 W22 RF Cable Z5623-20046 1 W23 RF Cable Z5623-20047 1 A2 Control Mother PCB Z5623-60016 1 Front Panel AY Z5623-60015 1 NOTE The above p
9 Safety and Regulatory Information Agilent Technologies Z5623A Option H48 9-1
Safety and Regulatory Information Safety Information Safety Information This document contains two types of safety notices: Warnings and Cautions. A Warning denotes a hazard that may endanger the operator. A Warning calls attention to a procedure, practice, or the like, which if not correctly performed or adhered to, could result in personal injury. Do not proceed beyond a Warning until the indicated conditions are fully understood and met. A Caution denotes a hazard that may endanger the instrument.
Safety and Regulatory Information Safety Information WARNING These servicing instructions are for use by qualified personnel only. To avoid electrical shock, do not perform any servicing unless you are qualified to do so. WARNING The opening of covers or removal of parts is likely to expose dangerous voltages. Disconnect the instrument from all voltage sources while it is being opened.
Safety and Regulatory Information Safety Information Instrument Markings When you see this symbol on your instrument, you should refer to the instrument’s instruction manual for important information. ! This symbol indicates hazardous voltages. The laser radiation symbol is marked on products that have a laser output. This symbol indicates that the instrument requires alternating current (ac) input. The CE mark is a registered trademark of the European Community.
Safety and Regulatory Information Regulatory Information Regulatory Information Statement of Compliance with IEC 1010 This instrument has been designed and tested in accordance with IEC Publication 1010, Safety Requirements for Electronic Measuring Apparatus, and has been supplied in a safe condition. The instruction documentation contains information and warnings which must be followed by the user to ensure safe operation and to maintain the instrument in a safe condition.
Safety and Regulatory Information Regulatory Information 9-6 Agilent Technologies Z5623A Option H48
10 Contacting Agilent Agilent Technologies Z5623A Option H48 10 -1
Contacting Agilent Contacting Agilent Contacting Agilent By internet, phone, or fax, get assistance with all your test and measurement needs. This information supersedes all prior HP contact information. Online assistance: www.agilent.