3-53
Eye-Diagram Analyzer Reference
Agilent 70820A User-Corrections
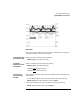
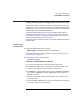
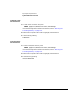
The following two figures show the effect of selecting linear slope and flat
types. The trace graphically shows the filter. With the exception of the path to
next FREQ field, the data in each filter is identical.