PSA6005 & PSA3605 6GHz & 3.
CONTENTS 1 Product Introduction.....................................................................................................6 1.1 Items Supplied ..........................................................................................................6 1.2 Using this Manual - Cross References .....................................................................6 1.3 Product Description and Capabilities ........................................................................6 1.
4.3.6 Detector Type .......................................................................................................21 4.4 Setting the Level Attenuator, Amplitude Scale, and Limits .....................................22 4.4.1 Measurement Units and Graticule .........................................................................22 4.4.2 Reference Level ....................................................................................................22 4.4.3 Vertical Scaling ......................
6.1 Additional Functions from Option U02 ....................................................................43 6.1.1 Scan Mode............................................................................................................43 6.1.2 Logging of Values, Traces or Screens ..................................................................43 6.1.3 Automatic Measurements .....................................................................................43 6.1.4 Modulation Waveform Display ...........
7.11.5 Logging from Amplitude Limits ..............................................................................56 7.11.6 Logging Every Sweep (Continuous) ......................................................................56 7.11.7 File Sizes and Maximum Logging Times...............................................................56 7.11.8 Viewing and Analyzing Logging Files ....................................................................57 7.12 Using Automatic Measurements.........................
13.1.1 13.1.2 13.1.3 13.1.4 13.1.5 13.1.6 13.1.7 13.1.8 14 15 16 17 Frequency Measurement ......................................................................................72 Amplitude Measurement (Level) ...........................................................................73 Sweep and Traces ................................................................................................74 Scan Mode (only with Option U02) .......................................................................
1 Product Introduction 1.1 Items Supplied Portable Spectrum Analyzer (PSA3605 or PSA6005) with removable stylus and detachable bench-stand/screen-protector. Spare stylus duplicates the stylus fitted into the instrument. USB lead Mini B plug to standard A plug. Trigger input converter plug 3.5mm jack to BNC socket. AC line power-supply/charger Universal voltage with interchangeable country specific plugs. Short Guide (English, French, German, Italian and Spanish). Full instruction manual (English only).
A reference trace and a view trace can be displayed in addition to the live trace. Up to 999 traces can be stored to permanent memory for recall to the screen or for data export. 999 instrument set-ups and 999 complete screen bitmaps can also be stored. All files can be given user defined names. USB interfaces are provided for direct file transfer to a PC or for connection of a USB Flash drive.
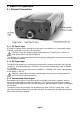
2 Basics of Operation 2.1 External Connections 2.1.1 DC Power Input DC power to operate and/or recharge the instrument is connected via a 1.3mm power socket mounted on the right hand side of the instrument. Use ONLY the power-supply/charger provided by Aim-TTi with the unit. Use of any other power source will void the warranty. The red lamp next to the socket flashes whilst charging is taking place and becomes continuous once charging is complete. 2.1.
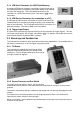
2.1.4 USB Host Connector (for USB Flash Memory) A standard USB type A connector is provided on the left hand side of the instrument which is revealed by moving the sliding cover towards the top of the instrument. This is intended exclusively for the connection of a USB Flash memory stick. See section 9.1.2 for full information. 2.1.
2.3 Batteries and AC Line Power 2.3.1 Battery Operation The instruments operates from an internal Lithium-ion rechargeable battery which can provide more than 3 hours of continuous operation (screen brightness dependent). The battery condition is indicated on the display via a multi-segment battery symbol. When it changes colour to yellow, expected battery life has fallen below 30 minutes. When it turns red, expected battery life has fallen below 10 minutes, and the analyzer should be recharged.
2.4 Display and Controls Layout Fig.
2.5 Touch Screen Operation The normal mode of operation of the spectrum analyzer is by using the touch-screen keys within the display supplemented, when required, by the hard keys below. The touch screen keys are normally operated by pressing with the finger or thumb, but can alternatively be operated using the supplied stylus. 2.5.1 Finger Tip Operation The touch screen is a resistive single-touch type (rather than the capacitive multi-touch type used on many smart phones).
3 Quick Start Guide It is recommended that all users, including those fully familiar with RF spectrum analyzers, take a little time to read through this instruction manual before using the instrument. However, for users who wish to get started with hands-on operation as quickly as possible, the following may prove useful. 1. Press and hold the Power key until a short beep is heard. Wait a few seconds and then check the battery condition indicator on the display.
4 Operation using the Menu System The default menu system for the spectrum analyzer consists of three rows of five keys. The upper row represents the top level of the menu system and defines five “menu groups” as follows: Freq/ Span Sweep/ BW enables the frequency range of sweep to be set in terms of start and stop frequencies or centre frequency plus span, as well as zero span demodulation. enables control of the sweep and bandwidth filtering for the sweep.
4.1.1 Centre Centre Set Centre Set C=M1 Set C=Pk Step Down controls the centre frequency for the sweep. Also sets the annotation to Centre/Span if it was previously Start/Stop. Creates a set of bottom-row function keys as follows: enables the centre frequency to be set to a specific value. The menu keys are replaced by a numeric keyboard from which a centre frequency can be entered in MHz to a resolution of 0.0001 (100Hz).
4.1.3 Start/Stop Start Stop Set Start controls the start and stop frequencies for the sweep. Also sets the annotation to Start/Stop if it was previously Centre/Span. Creates a set of bottom-row function keys as follows: Set Stop enables the start or stop frequency to be set to a specific value. The method for setting these is similar to that for setting the Centre frequency - see section 7.3 for an illustrated description of frequency setting.
4.1.5 Frequency Presets enables up to six frequency ranges to be quickly stored and recalled. Only the centre and span (or equivalent start and stop frequencies) are stored. This differs from a Trace State or Set-up file for which more parameters are stored (see sections 9.2.3 or 9.2.5 respectively). Frequency presets are retained when the instrument is off. Creates a set of bottom-row function keys as follows: Freq Presets Full Span sets the sweep to the full range of the instrument (10MHz to 3.
Audio Volume. controls the volume in 15 steps as shown on a bar graph. The audio can also be muted and a hiss reducing filter applied. Note that the RBW needs to be set appropriately for the modulation. As a broad guide the RBW should be set greater than the channel bandwidth. However, setting an excessively wide RBW will introduce unnecessary noise. 4.2.2 Waveform Demodulation Sub Menu (when fitted) When option U02 is installed, the waveform of the modulation can be displayed for AM or FM signals.
4.3 Setting the Sweep Mode, Bandwidth (RBW / VBW) & Detector This menu group controls the sweep, the resolution bandwidth filters and the detector mode. Sweep/ BW RBW/ VBW Sweep Time Sweep Control Sweep Mode Detector Type This enables the resolution bandwidth of the sweep filter and the subsequent video filtering to be controlled along with sweep time (normal or fast) and the type of sweep (repeat or single).
enables the sweep time to be reduced in order to speed up the response to changing events. Three levels of speed up are available indiciated by [F1], [F2], [F3] replacing the [N] after the sweep time display. To warn the user of reduced level measurement accuracy, a yellow background is applied. The maximum levels of sweep time reduction are 2, 5 or 10 but the actual reductions are dependent upon span and RBW/VBW settings – see section 7.5.4.
4.3.4.2 Triggered Sweep (when fitted) When upgrade option U02 is fitted, it is possible to trigger the sweep using an external or internal trigger signal. Triggered sweep has a different action dependent upon the sweep mode (Single or Repeat). If the sweep mode is set to Single, the effect of the trigger is to start the sweep. When a trigger event occurs a single sweep will be initiated. The trigger options are None, Ext +ve (trigger from a positive going edge on the external trigger input) or Ext -ve.
4.4 Setting the Level Attenuator, Amplitude Scale, and Limits This menu group controls the input attenuator, thus changing the reference level, and controls the measurement units and scaling of the amplitude display. When option U02 is fitted, it also enables the sweep amplitude to be compared with limit lines or patterns and the use of level offset and compensation tables. Level/ Limits Units/ Graticule Ref Level Scale/ Shift Offset/ Tables Limits 4.4.
4.4.3 Vertical Scaling Scale/ Shift enables the vertical amplitude scaling to be changed. Creates a set of bottom-row function keys as follows: Scale creates a pop-up menu enabling the vertical scaling to be set to 10dB/div (the default) through to 1dB/div. Shift Down Shift Down For scales below 10dB/div only a portion of the sweep amplitude will be visible and the Shift Up/Shift down keys can be used to pan the trace through the amplitude range of the graticule. These keys auto-repeat. 4.4.
4.4.5 Amplitude Limits (when fitted) Limits sets one or two horizontal lines or complex patterns that can be compared with the sweep. This function is only available when the upgrade option U02 is fitted - see section 6. Creates a set of bottom-row function keys as follows: creates a control screen that enables the selection of lines and patterns, or allows existing ones to be turned on or off. When Set Line is pressed, the value can be entered numerically in dBm or dBuV.
4.5 Controlling and Storing Traces and Images This menu group controls the traces that appear on the screen (as well as the markers that are used for measurement). Traces/ Markers Traces Control Trace Mode Trace Stores Marker Setup Marker Control There are three traces: Live (green), View (white) and Reference (purple). Only the Live trace is updated from the sweep. The View trace is a temporary copy of the live trace created whenever the View key is pressed.
The measurement markers normally operate on the Live trace. However, the Live and View traces can be “swapped” by pressing the Swap key. This stops the sweep and causes the View trace to be placed in front of the Live trace. When the traces are swapped, the measurement markers operate on the View trace. When the sweep is re-started (or the Swap key pressed again), the View and Live traces are swapped back. Either the Live trace or the View trace can be saved to a trace file (see section 5.1).
Swap Traces Average Number -more2 of 2 swaps the traces so that the “processed” trace is in front of the Normal trace – see section 4.5.3.1. creates a pop-up menu that enables the number of sweeps averaged to be set between 2 and 48 . returns to the first set of actions keys as detailed above. 4.5.3.1 Dual Trace Mode When the trace writing mode is set to Peak Hold or Average, a dual trace mode can be selected whereby the processed and un-processed traces are displayed simultaneously.
4.6 Using Measurement Markers This menu group controls the markers that are used for measurement (as well as the traces that appear on the screen). There are two markers M1 and M2 which provide a readout of amplitude at any frequency point on the trace. M2 can only be on if M1 is on, and the frequency difference between the two is also shown. Markers can be set to automatically find peaks, or track the largest peak. Traces/ Markers Traces Control Trace Mode Trace Stores Marker Setup Marker Control 4.6.
4.6.2 Controlling Markers Marker Control controls the frequency position of the markers. Creates a set of bottom-row function keys as follows: M1/M2 Active selects which marker is controlled by the marker movement keys. The active marker is indicated by an arrow (>) in front of its readout. Manual Set enables the frequency position of the active marker to be set numerically using similar frequency entry screens as for Set Centre (see section 4.1.1).
Function = Peak Track Peak Track mode can only be selected for M1. It is selected from Marker Setup > Function, and is indicated by an upwards arrow followed by a capital T on the left hand side of the marker readout. When selected the marker will attempt to track the highest peak of the live trace. Marker Frequency Precision The frequency position of a marker is always shown to a resolution of 0.0001MHz (100Hz). However, the actual position of the marker is a function of the span.
4.7 Instrument Setups and Additional Functions This menu group controls logging and automatic measurement functions when fitted (see section 6). It also controls store/recall of instrument set-ups and access to system functions and file operations, which are covered in the following section - section 4.8. Setup/ Functions Logging Auto Measure Freq. Counter Setups System/ File Ops 4.7.1 The Data Logging Function (when fitted) Logging Logging is only available when the upgrade option U02 is fitted.
Set Chn Spacing only appears for ACPR measurement type. Opens a numeric entry screen enabling the channel spacing to be entered in MHz. Note the Span and associated RBW/VBW are not set by the Automatic Measurement function, but must be set manually to an appropriate value. For further information about the Automatic Measurements function see section 7.12. 4.7.3 Frequency Counter Options Freq.
4.8 Storing and Recalling Set-ups | System Settings This menu group controls storing and recalling complete instrument set-ups, and access to system functions such as screen brightness and file operations (as well logging when fitted see section 4.7.1). Setup/ Functions Logging Auto Measure Freq. Counter Setups System/ File Ops 4.8.1 Storing and Recalling Instrument Setups Setups enables the complete setup of the instrument to be stored and recalled via user nameable files. See section 9.2.
4.9 Status Information | On-screen Help | System Utilities This menu group is accessed using the hard key marked STATUS/Help or by the soft key Setup/Functions > System/File-Ops > System Utilities. When the key is pressed, the normal key menu is replaced by a special menu as shown opposite. 4.9.1 Status Display When the Status/System key is selected, the top part of the screen is replaced by a detailed listing of the current instrument setup conditions. The status information is split over four pages.
4.9.3.2 Power Options, Power-on State, Clock Setting Power/ Clock enables aspects of the power on-off system to be set, along with the real-time clock. Creates a set of bottom-row function keys as follows: Set Date opens a dialogue box from which the date and time can be set for the real-time & Time clock. Times are in 24 hour format and dates are day-month-year. creates a pop-up menu that enables the instrument to be automatically turned off after a period of inactivity.
4.10 Using Instrument Presets | Automatic Setting This special menu is accessed using the hard key marked PRESET (Presets/Auto). Its function is to enable the overall setup of the instrument to be changed quickly to suit specific requirements. Standard Preset User Preset Auto Set Recall Setup Restore Previous Standard sets the frequency, level and sweep parameters back to known state and cancels Preset the more complex functions of the instrument (see section 10.2).
5 File Storage for Traces, Screen Images & Set-ups The instrument incorporates a large Flash based disk drive for the storage of a variety of different file types including Traces, Screen Images and Instrument Set-ups. When the upgrade pack (U02) is fitted it may also include Logging Files, Limit Pattern Tables and Amplitude Compensation Tables. The instrument filing system provides a consistent method for storing, recalling, renaming, deleting and copying files.
It is also possible to delete or rename files from this screen by pressing File Utilities - see section 5.5. 5.1.1.1 Default File Name Rules Default names are always five characters long, but the user can choose to enter less than five characters and the system will add the appropriate number of underscores at the end. The five characters are followed by a three digit number that starts at 001 and autoincrements up to 999.
5.3 Storing Instrument Set-up Files Storing of Instrument Set-ups is controlled from the menu function: Setup/Functions > Setups > Store Setup. (as described in section 4.8.1) This function enables a complete instrument set-up to be stored as a file within the internal memory. (N.B. external memory cannot be used to store files directly, although files can be copied to external memory later). The menu keys are replaced by a control screen as shown.
5.5 File Utilities Screen Store and Recall screens include a File Utilities key which enables files to be renamed or deleted. The layout is similar to a File Recall screen - see section 5.4 . Pressing Rename brings up the alpha-numeric keypad from which the file name can be changed. See section 5.6.1 for an explanation of file renaming. Pressing Delete asks for confirmation before permanently deleting the selected file. 5.
On the first occasion that the external drive is accessed there will be a delay and a warning message will be displayed - see section 9.1.2. Pressing Link to PC causes all spectrum analyzer operation to be suspended and enables a connection to be made to a personal computer. See section 9.1.3 for a detailed explanation. Pressing File Actions changes the screen to provide options of Rename, Delete or Copy. Rename and Delete operate in a similar way as for the File Utilities screen - see section 5.5.
5.6.2 File Names Created or Renamed Externally Files may be created externally or created within the instrument and renamed externally (e.g. using Link to PC mode). Such files may have long file names and/or include lower case characters and additional characters such as ?. The instrument will correctly list all such files that conform with an 8.3 naming system and which have the correct extension for the relevant folder.
6 Upgrade Option U02 The capabilities of the instrument can be enhanced by installing the upgrade option U02 which adds additional firmware to the instrument. Option U02 can be downloaded from the Aim-TTi website and can be installed by the user without any requirement to return the instrument to its supplier. Activation of the upgrade is achieved via an activation code which can be purchased from Aim-TTi, or from our distributors and agents across the world. 6.
6.1.8 Compensation Tables Compensation tables are lists of amplitude versus frequency which enable frequency related amplitude variations from antennae or transducers to be compensated for within the spectrum analyzer. Compensation tables are stored as files. See section 7.9.2 for more information. 6.1.9 Custom Presets Custom Presets enables multiple presets (set-ups) to be saved/recalled just by entering a number. See section 7.3.5. 6.1.
7 Further Notes on Operation 7.1 Signal Overload Levels and Indication The maximum input level without damage is +25dBm or +132dBuV of RF power (approximately 4 volts RMS), or 50V DC. The maximum signal that can be measured is +20dBm with the Reference level set to +20dBm. Signals that would cause the trace to rise above the reference level are indicated by a red arrow at the top of the graticule.
Set Centre pressing this key will bring up either the Set by Keypad screen or the Set by Tab/Jog screen depending upon which one was last used for setting that frequency parameter. 7.3.1 Set by Keypad This control screen replaces the menu with a 0 to 9 keypad. The frequency is entered in MHz using the decimal point if required (maximum resolution 0.0001MHz). Frequencies can be entered just to the resolution required – following digits become zeros.
Wider Span Having set a frequency span in which the signals of interest are visible, the user may wish to examine a wider span in order to see further signals not currently visible. One method of doing this is to zoom out from the Span sub-group menu (Freq/Span > Span > Zoom) which shows frequencies both above and below the current span. Alternatively, the user may wish to look only at frequencies above (or below) the current span.
7.4 Measuring Relative Amplitude When both measurement markers are turned on, a readout is provided of the difference between them in terms of both frequency and level. A common requirement is to measure the signal amplitude at a specific frequency under different conditions. The PSAxx05 provides a convenient method of doing this. Having measured the amplitude in the initial condition using marker M1, the value can be fixed from the Marker Setup sub-group menu (Traces/Markers > Marker Setup > Fix/Unfix M1).
allowing potential images of signals at the reference level to exceed the noise floor by a userdefined amount before action is initiated. The Threshold key can be used to set the tolerated image level to be 0dB (default), 3dB, 6dB, or 12dB above the noise floor with the current RBW for a signal at the reference level. Data Comparison (D.C.) Modes - General Two alternative sweep modes are available that provide a different balance between sweep speed and image rejection.
Distortion and non-linearities within the analog circuitry of the instrument can create very low level signals that could be visible for settings where the noise floor is very low. These are referred to as Spurii. DC Modes have the further advantage of reducing Spurii. 7.5.3 Revealing the Image The multiple IF frequencies used within the PSA Series 5 can result in a group of up to three images appearing close together at around 20MHz below the signal frequency.
7.6 Radiated and Injected Signals 7.6.1 Self-radiated Signals In common with most handheld spectrum analyzers, low level signals generated from the internal circuitry can be picked up with an antenna. Indicative measurements made with a 30cm (12”) whip antenna, mounted directly onto the signal connector and extending in line with the instrument, showed self-radiated peaks typically around -90dBm.
7.8 Triggered Operation Triggered operation is only available when the upgrade option U02 is fitted (see section 6). Triggering is used either to start or stop the sweep, or to initiate logging of sweeps or screen images. The trigger can be generated manually (by a key press), externally (from the trigger input) or internally from the sweep in combination with a limit line or limit pattern. For a description of Triggered Sweep see section 4.3.4.2. For a description of Triggered Logging see section 7.11. 7.
A compensation table file is loaded in a similar way to other types of file using a File Recall screen - see section 5.4 . Note that compensation tables and limit patterns are both placed in a folder called Tables and can therefore appear within the same File Utilities screen. It is possible to toggle between the two file types by pressing the key marked Tables (toggle). 7.
The Limit Action can be set to None, Beep, Pulse Out, Beep and Pulse Out together, or Message. The action only takes places when the sweep has completed. The Pulse Out is provided at the Trigger socket - see section 7.8.2. Regardless of the setting of the Trigger Action, it is also possible to use the limit condition to stop the sweep (see section 4.3.4.2) or to create an entry into a logging file (see section 7.11.5). 7.10.
7.11 The Logging Function The Logging function is only available when the upgrade option U02 is fitted (see section 6). A description of the menu keys used to control the function is given in section 4.7.1. The logging function saves results into log files within the memory of the instrument.
File Utilities: displays a list of logging files currently within the instrument. Operates similarly to other file utilities screens – see section 5.5. 7.11.2 Manual Logging The logging function can be set via the Log Trigger key to save entries in response to a manual key press. Both the Run/Stop hard key and the sweep control touch-screen key act as the manual trigger. The data that is logged will relate to the sweep that was in progress when the key was pressed. 7.11.2.
Although the filing system allows up to 999 .LOG files to be stored, the practical number may be limited by the internal memory size (approximately 1.8GB). Where large files are being created, care must be taken not to overflow the memory. Memory space can be restored by copying files to a Flash drive or directly to a PC, and then deleting them on the instrument. The instrument has the potential to log over very long periods.
Setting the channel bandwidth and turning the measurement function on causes two yellow markers to be positioned at the channel limits, equidistant from the centre frequency. The Channel Power is shown in dBm. 7.12.2 Adjacent Channel Power Ratio (ACPR) This measures the relative power, in dBm, of a main channel to its higher and lower adjacent channels.
8 Scan Mode 8.1 Scan Mode Explanation Scan mode is a facility which enables spans to be analyzed with a higher resolution than in normal sweep mode. In scan mode the analyzer creates a file containing data that would normally be discarded. This high resolution file can be analyzed using the display of the PSA, on a PC using PSA-Manager, or exported as a CSV file for use with other programs. Scan mode is only available when option U02 ( and Updatable Firmware v2.xx or above) is installed. 8.1.
8.1.4 Saving, Recalling and Exporting Scan Mode Files The files created from scan mode can be saved in a similar way to trace files. These can be recalled to the display of the PSA or can be exported to a PC for display and analysis using PSA-Manager or third party software. Scan files are saved to the TRACES directory of the PSA, and are distinguished from trace files by having a file name that starts with a $ symbol.
Abort Scan stops the scan operation. A scan can not be paused, once aborted the data is lost and it must be run again from the start. 8.2.3.1 The Scan Display When a scan is completed, or when a stored scan is recalled, the graticule area shows an overview of the complete scan in light blue. In addition, the area directly below the graticule shows a vertically compressed version in light grey.
View Full this key is the alternate function of the Max. Zoom key and is therefore only available at maximum zoom. It is a shortcut back to the display of the full scan Scan the pan keys move the zoomed display in steps of ten display points. The keys auto repeat. The marker moves with the pan so that its position on the graticule does not change. Pan < Left Pan Right > Marker In scan mode there is only one marker position.
A scan that is recalled without its state retains its frequency and level information so that the graticule scaling and marker readout remain correct. However, the information in the upper annotation area will show the current setup rather than the state for the recalled file. 8.2.3.4 Exporting Scan Files Exportable scan files are in .CSV format (comma separated variable format) and can be transferred to a PC for external use in a similar way to trace files.
9 USB Connections | File System & Files Types 9.1.1 Understanding USB Connections The instrument has two USB ports only one of which may be used at a time. The required port is accessed by a sliding shutter which ensures that only the exposed port can be used. The Type A port presents a USB host interface which will accept flash drives conforming to the USB Mass Storage Class (MSC). Drives with capacities from 32MB to 32GB are supported.
Note that, whenever the File Ops function is first used after a USB Flash Drive has been plugged in or the instrument has been switched off, the files on the Flash Drive will be interrogated and an information message will appear asking the user to wait for this to take place. If the Flash Drive is of large capacity and/or contains a large number of files, the interrogation could take a long time. If the user wishes to abort this procedure, they may do so by simply unplugging the Flash Drive.
9.2.3 Trace Files A trace file represents the swept trace as appears upon the screen. A trace file can be recalled to the screen as a reference trace (purple). The file consists of a set of 271 values representing the trace amplitude from left to right across the screen in CSV (comma separated variable) format, plus additional information that defines the frequency span, RBW, VBW and reference level. Values are always in dBm. The latter information is referred to as the State.
9.2.6.2 Compensation Tables Compensation tables are normalised files of amplitude versus frequency which must be created outside of the instrument using PSA-Manager software. They are a few kilobytes in size. They files have the extension .CMP and are located in the folder named TABLES. Files can be transferred using either a USB Flash drive, or by direct connection to the USB port of a PC. 9.2.6.
10 Default Settings | Power On State | Hard Reset 10.1 Restoring to Factory Defaults When shipped from the factory, the set-up of the instrument is as described within Appendix B (section 18). The instrument can be returned to its factory defaults condition from Setup/Functions > Setups > Load Defaults (see section 4.8.1). 10.2 Standard Preset The standard preset is accessed by pressing the hard key marked Preset.
10.4 Power-On State The set-up of the instrument each time that it is turned on (from off) is normally set to “Last Used”. This results in no change occurring when the instrument is powered off and then back on. Alternatively, the user can choose to load the User Preset which overwrites the major settings with ones chosen by the user (see section 4.10.1). This choice is made from: STATUS >System Utils > Power/Clock > Pwr-On State - see section 4.9.3.2.
11Firmware Updates | Upgrades | Maintenance 11.1 Updating the Firmware From time to time Aim-TTi may make updated versions of the instrument firmware available in order to add new features or to correct “bugs”. These will be downloadable from the Aim-TTi website without charge. The current version is displayed within the Status display screens. The method of updating requires the use of a USB Flash drive. Full information on how to perform the update will be provided with the firmware file. 11.
12 Safety Information Spectrum Analyzer This instrument is Safety Class III according to IEC classification and has been designed to meet the requirements of EN61010-1 (Safety Requirements for Electrical Equipment for Measurement, Control and Laboratory Use). This instrument has been tested in accordance with EN61010-1 and has been supplied in a safe condition.
13 Specification PSA3605 limits, where different, are shown in square brackets [ ] after the PSA6005 limits. 13.1.
Zero Span Audio Demodulation Demod. Modes: AM or FM Internal Audio: Internal loudspeaker with adjustable volume and mute Audio Out: 30 mW into 32 Ohms mono or stereo headphones, adjustable volume, 3.5mm jack socket (auto disconnect of internal loudspeaker) Audio Filter Selectable low-pass filter to attenuate high frequency interference. 2 pole filter with turnover point at approximately 3 kHz.
Amplitude Compensation (only with Option U02) Offset: Amplitude can be offset by up to +/-50dB to compensate for external attenuation or gain. 75Ω Compensation Compensation can be made for inputs from a 75Ω source impedance. Compensation Linearly interpolated tables of up to 49 frequency/amplitude points can Tables: be used. Up to 999 tables can be stored. Table files are created using PSA-Manager software.
File Storage: Scan files can be saved under automatic or user defined names and recalled to the screen or exported to external programs. 13.1.5 Memory Storage and Data Logging Memory Storage Memory Type: Store Trace: Recall Trace: Store Screen: Recall Screen: Store Set-up: Recall Set-up: Store Scan: Recall Scan: Store Logging File: Internal non volatile Flash memory (1.8GB nominal). Up to 999 traces can be stored under either default file names or user entered file names.
USB Flash Drive interface: Audio Connector: Trigger connector: Display Display Type: Graticule: USB standard A connector (USB Host) for connection of USB Flash memory drive 3.5 mm jack socket for demodulated audio out (mono/stereo plugs). 3.5mm mono jack socket for connection of BNC adaptor (supplied). 4.3 inch (10.9 cm) transflective backlit TFT LCD, 480 x 272 pixels total, 16 colours, resistive touch screen. 8.5 x 10 divisions light grey graticule. Selectable as normal, dim, levels only, or off. 13.1.
14 Appendix A: Optional Accessories Firmware Upgrade (PSA-U02) – provides increased capabilities - see section 6 . Fitted Soft Case (PSA-SC2) – protective carrying case with space for accessories Telescopic Antenna (PSA-ANT2) – wideband telescopic antenna with adaptor for N-type connection direct to the PSA. Vehicle Charger (PSA-VC) – charger operating from 12V or 24V. NOTE: All of the above items are included within the PSA3605USC and PSA6005USC products.
PSA-View PSA-View is an additional PC application which can be used with the View-on-PC function of the instrument when option U02 is installed. It enables the screen of the instrument to be duplicated on the PC at any desired size. The View on PC function places the instrument into a special mode in which the graphics of the display are sent to a PC via USB.
16 Appendix C: Factory Default Settings When shipped from the factory, or following a reset to factory defaults, or operation of the hard reset button, the instrument will be set up as follows: (note that some parameters are relevant only if Option U02 is fitted) Frequency/Span (Mode = Centre/Span) Zero Span Demodulation Setup Sweep/Bandwidth Level/Limits Offset/Tables Limits Traces/Markers Trace Control Trace Mode Trace Stores Marker Setup Setup/Functions Logging Auto Measure Frequency Counter Setups
17 Appendix D: Menu Tree Diagram Page 80
Page 81
Thurlby Thandar Instruments Ltd. Glebe Road • Huntingdon • Cambridgeshire • PE29 7DR • England (United Kingdom) Telephone: +44 (0)1480 412451 • Fax: +44 (0)1480 450409 International web site: www.aimtti.com • UK web site: www.aimtti.co.uk Email: info@aimtti.com Aim Instruments and Thurlby Thandar Instruments Book Part No.