
User guide


GLD Touch Screen Reference V1.2 – Issue 1 11 ALLEN&HEATH
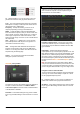
In - Switch the PEQ in or out of circuit. The curve turns
yellow when switched in and grey when switched out.
Type - The LF and HF EQ bands may be set as shelving,
bell shaped or low/high cut filter response. When set as a
filter the response is 12dB/octave.
Frequency - Sweeps the shelving, centre or cut-off
frequency depending on the type of the EQ band.
Width - Adjusts the width of the bell shaped EQ band.
Push and turn the Frequency rotary or use the screen. The
value is shown in octaves. Higher values up to 1.4 affect a
wider range of frequencies. Lower values down to 1/9th
affect a narrower range. A value of 1/3 has a similar affect to
the Graphic EQ.
Gain - Allows up to +/-15dB boost or cut for each EQ
band. 0dB represents a flat response. It is typical to cut
rather than boost when live mixing.
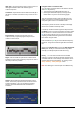
HPF - The High Pass Filter attenuates low frequencies
below its cut-off frequency with a slope of 12dB/octave.
Switch in or out using the In button. The HPF can also be
adjusted using the Preamp page.
Library - You can store and name the current PEQ
settings as a preset in the Library.
OPTIONS pull-up window
The frequency range for the 4 bands may be set globally for
all inputs or mixes to be limited or full 20Hz to 20kHz.
A Fill Curves option to show the overall or individual effect
of the EQ bands is available.
Sel button - Touch while holding the Copy, Paste or Reset
key to copy the PEQ settings to other channels or to reset it
flat.
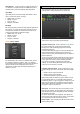
3.12 GEQ page
A 28-band 1/3 octave Graphic Equaliser is provided on
each of the 20 mix outputs. It can be adjusted using the
touch screen or the surface faders.
Frequency response curve – The top part of the screen
shows the combined response of the slider settings. This
can show the response differences between the four GEQ
types available.
RTA display – The Real Time Analyser display is
superimposed on top of the frequency response curve. The
RTA displays metering of the currently selected PAFL signal
split into its 1/3
rd
octave frequency bands. The meter bars
are shown in green. A red bar and a dot at the top indicate
the dominant frequency band if the Show Peak Band option
has been set in the Meters / RTA screen Options pull-up
window.
Note The RTA follows the current PAFL selection. Make
sure you have selected the PAFL key for the channel or mix
you wish to analyse, for example the related Aux mix when
you are using the GEQ and RTA to ring out a stage monitor.
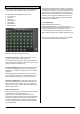
Using the screen to control the GEQ
Touch a frequency slider to highlight it. Drag the slider with
your finger or use the screen Rotary to adjust cut or boost
for the highlighted frequency band.
In - Switch the GEQ in or out of circuit. The settings turn
yellow when switched in and grey when switched out.
Sel button – Touch while holding the Copy, Paste or Reset
key to copy the GEQ settings to other mixes or to reset all
bands flat.