
User guide
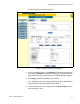
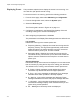
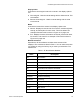
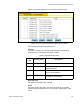
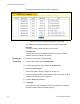
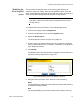
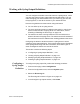
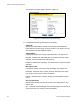
Table Of Contents
- Contents
- Figures
- Tables
- Preface
- Section I
- Basic Operations
- Chapter 1
- Basic Switch Parameters
- Configuring the Switch’s Name, Location, and Contact
- Changing the Manager and Operator Passwords
- Setting the System Date and Time
- Rebooting a Switch
- Pinging a Remote System
- Returning the AT-S63 Management Software to the Factory Default Values
- Displaying the IP Address of the Local Interface
- Displaying System Information
- Chapter 2
- Port Parameters
- Chapter 3
- Enhanced Stacking
- Chapter 4
- SNMPv1 and SNMPv2c
- Chapter 5
- MAC Address Table
- Chapter 6
- Static Port Trunks
- Chapter 7
- Port Mirroring
- Section II
- Advanced Operations
- Chapter 8
- File System
- Chapter 9
- File Downloads and Uploads
- Chapter 10
- Event Logs and Syslog Client
- Chapter 11
- Classifiers
- Chapter 12
- Access Control Lists
- Chapter 13
- Class of Service
- Chapter 14
- Quality of Service
- Chapter 15
- Denial of Service Defenses
- Chapter 16
- IGMP Snooping
- Section III
- SNMPv3
- Chapter 17
- SNMPv3
- Configuring the SNMPv3 Protocol
- Enabling or Disabling SNMP Management
- Configuring the SNMPv3 User Table
- Configuring the SNMPv3 View Table
- Configuring the SNMPv3 Access Table
- Configuring the SNMPv3 SecurityToGroup Table
- Configuring the SNMPv3 Notify Table
- Configuring the SNMPv3 Target Address Table
- Configuring the SNMPv3 Target Parameters Table
- Configuring the SNMPv3 Community Table
- Displaying SNMPv3 Tables
- Section IV
- Spanning Tree Protocols
- Chapter 18
- Spanning Tree and Rapid Spanning Tree Protocols
- Chapter 19
- Multiple Spanning Tree Protocol
- Section V
- Virtual LANs
- Chapter 20
- Port-based and Tagged VLANs
- Chapter 21
- GARP VLAN Registration Protocol
- Section VI
- Port Security
- Chapter 22
- MAC Address-based Port Security
- Chapter 23
- 802.1x Port-based Network Access Control
- Section VII
- Management Security
- Chapter 24
- Encryption Keys, PKI, and SSL
- Chapter 25
- Secure Shell (SSH)
- Chapter 26
- TACACS+ and RADIUS Protocols
- Chapter 27
- Management Access Control List
- Index
Chapter 10: Event Logs and Syslog Client
122 Section II: Advanced Operations
Displaying Events This procedure explains how to display the events in an event log. You
can view all or just specific events of a log.
To view the events in an event log, perform the following procedure:
1. From the home page, select either Monitoring or Configuration.
2. From the Configuration menu, select the System option.
3. Select the Event Log tab.
The Event log tab is shown in Figure 33 on page 121.
4. Configure the parameters in the Display Filter Settings of the tab
according to the types of events to be displayed.
5. After configuring the parameters, click View.
The parameters in the Display Filter Settings section are defined here:
Log Location
Defines the event log to be viewed: Options are:
Temporary (Memory) - Displays the events from the log stored in
temporary memory. This log stores approximately 4,000 events.
Select this option if the switch has been running for some time
without a reset or power cycle. This is the default.
Permanent (NVS) - Displays the events from the log stored in
nonvolatile memory, which stores up to 2,000 events. Select this
option to view the events that occurred prior to a recent reset or
power cycle.
Severity Selections
Defines the severity of the events to be displayed. You can select more
than one severity by using the Ctrl key when making your selections.
The default is error, warning, and information events. Options are:
D - Debug - Debug messages provide detailed high-volume
information only intended for technical support personnel.
E - Error - Only error messages are displayed. Error messages
indicate that the switch operation is severely impaired.
W - Warning - Only warning messages are displayed. These
messages indicate that an issue may require manager attention.
I - Information - Only informational messages are displayed.
Informational messages display useful information that you can
ignore during normal operation.
ALL - Messages of all severity levels are displayed.