
User guide


Chapter 6: Board Test System 6–21
The Power Monitor
December 2014 Altera Corporation Stratix V GX FPGA Development Kit
User Guide
■ HF2—Selects second lowest frequency divide-by-22 data pattern
■ LF—Selects lowest frequency divide by 33 data pattern
Error Control
This control displays data errors detected during analysis and allows you to insert
errors:
■ Detected errors—Displays the number of data errors detected in the hardware.
■ Inserted errors—Displays the number of errors inserted into the transmit data
stream.
■ Insert Error—Inserts a one-word error into the transmit data stream each time you
click the button. Insert Error is only enabled during transaction performance
analysis.
■ Clear—Resets the Detected errors and Inserted errors counters to zeros.
Start
The Start control initiates SMA transaction performance analysis.
1 Always click Clear before Start.
Stop
The Stop control terminates transaction performance analysis.
Performance Indicators
These controls display current transaction performance analysis information collected
since you last clicked Start:
■ TX and RX performance bars—Show the percentage of maximum theoretical data
rate that the requested transactions are able to achieve.
■ Tx (MBps) and Rx (MBps)—Show the number of bytes of data analyzed per
second.
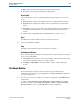
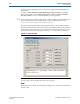
The Power Monitor
The Power Monitor measures and reports current power and temperature
information for the board. To start the application, click Power Monitor in the Board
Test System application.
1 You can also run the Power Monitor as a stand-alone application. PowerMonitor.exe
resides in the
<install dir>\kits\stratixVGX_5sgxea7kf40_fpga\examples\board_test_system
directory. On Windows, click Start > All Programs > Altera > Stratix V GX FPGA
Development Kit <version> > Power Monitor to start the application.