
User guide


42 Altera Corporation
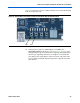
Stratix II Professional Filtering Lab
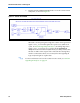
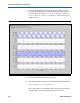
● Filtered Response – Filtered Data is the title of the
plot.
● 10e7 is the sampling frequency (100 MHz).
A MATLAB plot displays the frequency response of the filtered data,
as shown in Figure 32.
Figure 32. FFT Response of fir_result_tap—Filtered Data
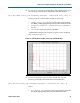
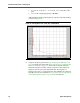
16. Compare the plots generated in step 14 on page 41 and step 15 on
page 41 with the plot generated in step 7 of “Exercise 2: Simulate the
Model in Simulink” on page 21. The hardware results match the
Simulink simulation results, with the exception of the impulse at
frequency 0 in the plot of the unfiltered data. The impulse at
frequency 0 occurs as a result of the DC offset added to the output of
the adder (see the second bullet in step 5 of “Review Changes Made
to the Filtering Lab Design” on page 35 for more details).