
Instruction manual


Appendix C – APDiagnostics
193
Instruction Manual – Enova DGX 8/16/32 Digital Media Switchers
System Visual Pane
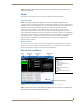
Event Status Notebook
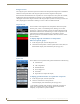
The Event Status Notebook is the panel with five tabs at the bottom of the Main Screen. The tabs in the
Event Status Notebook provide current data (Acquisition mode) or previous data (Emulation mode).
It provides updated status entries as the system is being monitored, providing a snapshot glance of the
most recent state of the system.
Note: A yellow or red outline around a data line indicates that the component was previously in
a Warning or Error state.
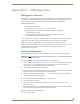
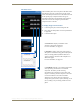
The System Visual pane is the right-most panel in the Main Screen and
presents a simple graphic representation of the different groups being
monitored by the application.
To display an appropriate image in System Visual pane:
1.
In the Categories pane, select the Diagnostics tab.
2. Click either the Temperature or Power System button.
3. In the Information pane, click Visual for the applicable
Temperature Groups or Power System Groups (Power Supplies are
illustrated in the graphic to the left).
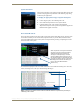
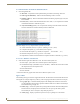
The information displayed in the Event Status Notebook is sorted under the following tabs: All Events,
Notices, Warnings, Errors, and Async Network Msgs (Messages).
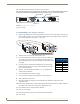
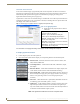
When components in the system exceed their
maximum and minimum levels of operation,
APDiagnostics flags that information as
warnings or errors depending on the data
received. APDiagnostics changes the color of
the Categories buttons in the Categories pane
(top arrow) to yellow for warning or red for error
and displays the information as Warnings or
Errors in the Event Status Notebook
(bottom arrow).
Tabs
Data Lines