
Datasheet


Table Of Contents
UG-003 Evaluation Board User Guide
Rev. A | Page 10 of 40
4. Note that other settings can be changed on the ADCBase 0
page (see Figure 12) and the ADC A and ADC B pages
(see Figure 13) to set up the part in the desired mode. The
ADCBase 0 page settings affect the entire part, whereas the
settings on the ADC A and ADC B pages affect the selected
channel only. See the appropriate part data sheet; the AN-878
Application Note, High Speed ADC SPI Control Software; and
the AN-877 Application Note, Interfacing to High Speed ADCs
via SPI, for additional information on the available settings.
08168-012
Figure 13. SPI Controller, Example ADC A Page
5. Click the Run button in the VisualAnalog toolbar (see
Figure 14).
0
8168-013
Figure 14. Run Button (Encircled in Red) in VisualAnalog Toolbar,
Collapsed Display
Adjusting the Amplitude of the Input Signal
The next step is to adjust the amplitude of the input signal for
each channel as follows:
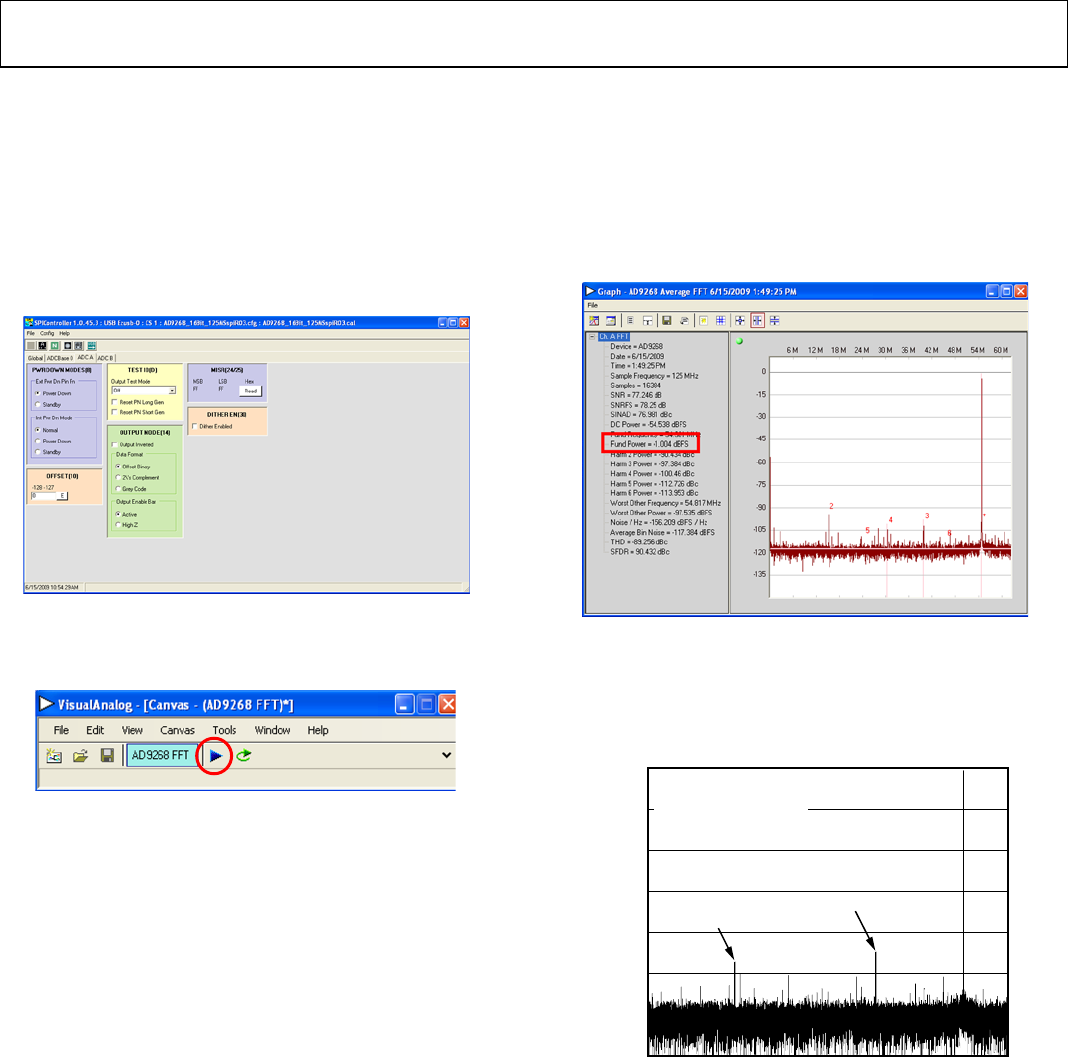
1. Adjust the amplitude of the input signal so that the
fundamental is at the desired level. Examine the Fund Power
reading in the left panel of the VisualAnalog Graph - AD9268
Average FFT window (see Figure 15).
0
8168-014
Figure 15. Graph Window of VisualAnalog
2. Repeat this procedure for Channel B.
3. Click the disk icon within the Graph window to save the
performance plot data as a .csv formatted file. See Figure 16
for an example.
0
–20
–40
–60
–80
–100
–120
–140
0 102030405060
FREQUENCY (MHz)
AMPLITUDE (dBFS)
125MSPS
70.1MHz @ –1dBFS
SNR = 76.5dB (77.5dBFS)
SFDR = 88.0dBc
SECOND HARMONIC
THIRD HARMONIC
08168-015
Figure 16. Typical FFT, AD9268/AD9258