
Datasheet

ADSP-21371
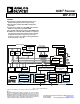
SYSTEM DESIGN
The following sections provide an introduction to system design
options and power supply issues.
Program Booting
The internal memory of the ADSP-21371 boots at system
power-up from an 8-bit EPROM via the external port, an SPI
master, or an SPI slave. Booting is determined by the boot con-
figuration (BOOTCFG1–0) pins (see Table 7 on Page 14).
Selection of the boot source is controlled via the SPI as either a
master or slave device, or it can immediately begin executing
from ROM.
The newly introduced “Running Reset” feature allows a user to
perform a reset of the processor core and peripherals, but with-
out resetting the PLL and SDRAM controller, or performing a
Boot. The functionality of the CLKOUT/RESETOUT
/RUN-
RSTIN pin has now been extended to also act as the input for
initiating a Running Reset. For more information, see the
ADSP-2136x SHARC Processor Hardware Reference for the
ADSP-21367/8/9 Processors.
Power Supplies
The ADSP-21371 has separate power supply connections for the
internal (V
DDINT
), and external (V
DDEXT
) power supplies. The
internal supplies must meet the 1.2 V requirement. The external
supply must meet the 3.3 V requirement. All external supply
pins must be connected to the same power supply.
Target Board JTAG Emulator Connector
Analog Devices DSP Tools product line of JTAG emulators uses
the IEEE 1149.1 JTAG test access port of the ADSP-21371 pro-
cessor to monitor and control the target board processor during
emulation. Analog Devices DSP Tools product line of JTAG
emulators provides emulation at full processor speed, allowing
inspection and modification of memory, registers, and proces-
sor stacks. The processor's JTAG interface ensures that the
emulator will not affect target system loading or timing.
For complete information on Analog Devices’ SHARC DSP
Tools product line of JTAG emulator operation, see the appro-
priate “Emulator Hardware User's Guide”.
DEVELOPMENT TOOLS
The ADSP-21371 is supported with a complete set of
CROSSCORE
®
software and hardware development tools,
including Analog Devices emulators and VisualDSP++
®
devel-
opment environment. The same emulator hardware that
supports other SHARC processors also fully emulates the
ADSP-21371.
The VisualDSP++ project management environment lets pro-
grammers develop and debug an application. This environment
includes an easy to use assembler (which is based on an alge-
braic syntax), an archiver (librarian/library builder), a linker, a
loader, a cycle-accurate instruction-level simulator, a C/C++
compiler, and a C/C++ runtime library that includes DSP and
mathematical functions. A key point for these tools is C/C++
code efficiency. The compiler has been developed for efficient
translation of C/C++ code to DSP assembly. The SHARC has
architectural features that improve the efficiency of compiled
C/C++ code.
The VisualDSP++ debugger has a number of important fea-
tures. Data visualization is enhanced by a plotting package that
offers a significant level of flexibility. This graphical representa-
tion of user data enables the programmer to quickly determine
the performance of an algorithm. As algorithms grow in com-
plexity, this capability can have increasing significance on the
designer’s development schedule, increasing productivity. Sta-
tistical profiling enables the programmer to nonintrusively poll
the processor as it is running the program. This feature, unique
to VisualDSP++, enables the software developer to passively
gather important code execution metrics without interrupting
the real-time characteristics of the program. Essentially, the
developer can identify bottlenecks in software quickly and effi-
ciently. By using the profiler, the programmer can focus on
those areas in the program that impact performance and take
corrective action.
Debugging both C/C++ and assembly programs with the
VisualDSP++ debugger, programmers can:
• View mixed C/C++ and assembly code (interleaved source
and object information)
• Insert breakpoints
• Set conditional breakpoints on registers, memory,
and stacks
• Perform linear or statistical profiling of program execution
• Fill, dump, and graphically plot the contents of memory
• Perform source level debugging
• Create custom debugger windows
The VisualDSP++ IDDE lets programmers define and manage
DSP software development. Its dialog boxes and property pages
let programmers configure and manage all of the SHARC devel-
opment tools, including the color syntax highlighting in the
VisualDSP++ editor. This capability permits programmers to:
• Control how the development tools process inputs and
generate outputs
• Maintain a one-to-one correspondence with the tool’s
command line switches
The VisualDSP++ Kernel (VDK) incorporates scheduling and
resource management tailored specifically to address the mem-
ory and timing constraints of DSP programming. These
capabilities enable engineers to develop code more effectively,
eliminating the need to start from the very beginning, when
developing new application code. The VDK features include
threads, critical and unscheduled regions, semaphores, events,
and device flags. The VDK also supports priority-based, pre-
emptive, cooperative, and time-sliced scheduling approaches. In
addition, the VDK was designed to be scalable. If the application
does not use a specific feature, the support code for that feature
is excluded from the target system.
Rev. 0 | Page 10 of 48 | June 2007