
Datasheet


SSM2166
Rev. D | Page 10 of 20
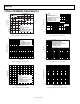
The performance of the rms level detector is illustrated for a
C
AVG
of 2.2 µF in Figure 17 and for a C
AVG
of 22 µF in Figure 18.
In each of these images, the input signal to the SSM2166 (not
shown) is a series of tone bursts in six successive 10 dB steps.
The tone bursts range from −66 dBV (0.5 mV rms) to −6 dBV
(0.5 V rms). As shown in Figure 17 and Figure 18, the attack
time of the rms level detector is dependent only on C
AVG
, but the
release times are linear ramps whose decay times are dependent
on both C
AVG
and the input signal step size. The rate of release is
approximately 240 dB/s for a C
AVG
of 2.2 µF and 12 dB/s for a
C
AVG
of 22 µF.
00357-017
•••••••• •••• •••• •••• •••• •••• •••• •••• ••••
•••••••• •••• •••• •••• •••• •••• •••• •••• ••••
100mV
100ms
–6dBV
–66dBV
–85dBV
100
90
10
0%
Figure 17. RMS Level Detector Performance with C
AVG
= 2.2 μF
00357-018
•••••••• •••• •••• •••• •••• •••• •••• •••• ••••
•••••••• •••• •••• •••• •••• •••• •••• •••• ••••
100
90
10
100mV 1s
–6dBV
–66dBV
–85dBV
0%
Figure 18. RMS Level Detector Performance with C
AVG
= 22 μF
CONTROL CIRCUITRY
The output of the rms level detector is a signal proportional to
the log of the true rms value of the buffer output with an added
dc offset. The control circuitry subtracts a dc voltage from this
signal, scales it, and sends the result to the VCA to control the
gain. The gain control of the VCA is logarithmic—a linear change
in the control signal causes a decibel change in gain. It is this
control law that allows linear processing of the log rms signal to
provide the flat compression characteristic on the input/output
characteristic shown in Figure 15.
Compression Ratio
Changing the scaling of the control signal fed to the VCA
causes a change in the circuit compression ratio, r. This effect is
shown in Figure 20. The compression ratio can be set by
connecting a resistor between the COMP RATIO SET pin (Pin
10) and GND. Lowering R
COMP
gives smaller compression ratios
as shown in Figure 19, with values of approximately 17 kΩ or
less resulting in a compression ratio of 1:1. AGC performance is
achieved with compression ratios between 2:1 and 15:1 and is
dependent on the application. A 100 kΩ potentiometer can be
used to allow this parameter to be adjusted. On the evaluation
board (see Figure 26), an optional resistor can be used to set the
compression equal to 1:1 when the wiper of the potentiometer
is at its full counterclockwise (CCW) position.
00357-031
ROTATION POINT
100mV rms
300mV rms
1V rms
1:1
0.1
0.1
0.1
2:1
8.7
8.7
8.7
5:1
19.4
19.4
19.4
10:1
45
45
45
15:1
395
N/A
N/A
COMPRESSION
RATIO
TYPICAL R
COMP
VALUES IN kΩ.
Figure 19. Compression Ratio vs. R
COMP
(Pin 10 to GND)
OUTPUT (dB)
INPUT (dB)
V
RP
15:1
5:1
2:1
1:1
1
1
VCA GAIN
00357-019
V
DE
Figure 20. Effect of Varying the Compression Ratio
Rotation Point
An internal dc reference voltage in the control circuitry, used to
set the rotation point, is user specified, as illustrated in Figure 9.
The effect on rotation point is shown in Figure 21. By varying a
resistor, R
ROT PT
, connected between the positive supply and the
ROTATION SET pin (Pin 11), the rotation point may be varied
by approximately 20 mV rms to 1 V rms. From Figure 21, the
rotation point is inversely proportional to R
ROT PT
. For example, a 1
kΩ resistor would typically set the rotation point at 1 V rms,
whereas a 55 kΩ resistor would typically set the rotation point
at approximately 30 mV rms.