Site Master S113C, S114C, S331C, S332C, Antenna, Cable and Spectrum Analyzer User's Guide Hand-Held Tester for Transmission Lines and other RF Components
WARRANTY The Anritsu product(s) listed on the title page is (are) warranted against defects in materials and workmanship for one year from the date of shipment. Anritsu's obligation covers repairing or replacing products which prove to be defective during the warranty period. Buyers shall prepay transportation charges for equipment returned to Anritsu for warranty repairs. Obligation is limited to the original purchaser. Anritsu is not liable for consequential damages.
Table of Contents Chapter 1 - General Information Introduction . . . . . . . . . Description . . . . . . . . . Standard Accessories . . . . Options . . . . . . . . . . . Optional Accessories . . . . Performance Specifications Preventive Maintenance . . Calibration . . . . . . . . . InstaCal Module . . . . . . Annual Verification. . . . . . . . . . . . . . . . . . . . . . . . . . . . . . . . . . . . . . . . . . . . . . . . . . . . . . . . . . . . . . . . . . . . . . . . . . . . . . . . . . . . . . .
Setting the Scale. . . . . . . . . . . . . . . . . . . . . . . . . . . . . . . . 3-7 Auto Scale . . . . . . . . . . . . . . . . . . . . . . . . . . . . . . . . . . . . . . 3-7 Amplitude Scale. . . . . . . . . . . . . . . . . . . . . . . . . . . . . . . . . . . 3-7 Save and Recall a Setup . . . . . . . . . . . . . . . . . . . . . . . . . . . 3-7 Saving a Setup . . . . . . . . . . . . . . . . . . . . . . . . . . . . . . . . . . . 3-7 Recalling a Setup . . . . . . . . . . . . . . . . . . . . . . . . . . . . .
Chapter 7 - Site Master Software Tools Introduction . . . . . . Features . . . . . . . . System Requirements. Installation . . . . . . . . . . . . . . . . . . . . . . . . . . . . . . . . . . . . . . . . . . . . . . . . . . . . . . . . . . . . . . . . . . . . . . . . . . . . . . . . . . . . . . . . . . . . . . . . . . . . . . . . . . . . . . . . . . . . . . 7-1 7-1 7-1 7-2 Communication Port Setting. . . . . . . . . . . . . . . . . . . . . . . . . . . .
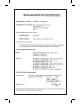
Chapter 1 General Information Introduction This chapter provides a description, performance specifications, optional accessories, preventive maintenance, and calibration requirements for the Site Master models S113C, S114C, S331C, and S332C. Throughout this manual, the term Site Master will refer to the models S113C, S114C, S331C, and S332C.
Chapter 1 General Information The following items are supplied with the basic hardware. · Soft Carrying Case · AC-DC Adapter · Automotive Cigarette Lighter 12 Volt DC Adapter, · CDROM disk containing the Software Tools program.
Chapter 1 General Information · Armored Test Port Extension Cable, 3.0 meter, N (m) to N (m), Part No. 15NN50-3.0C · Armored Test Port Extension Cable, 5.0 meter, N (m) to N (m), Part No. 15NN50-5.0C · Armored Test Port Extension Cable, 1.5 meter, N (m) to 7/16 DIN (f), Part No. 15NDF50-1.5C · Armored Test Port Extension Cable, 1.5 meter, N (m) to 7/16 DIN (m), Part No. 15ND50-1.5C · RF Detector, 1 to 3000 MHz, N(m) input connector, 50 Ohms, Part No. 5400-71N50 · RF Detector, 0.
Chapter 1 General Information Table 1-1. Performance Specifications (1 of 2) Specifications are valid when the unit is calibrated at ambient temperature after a 5 minute warmup. Typical values are provided for reference only and are not guaranteed. Value Description Site Master: Frequency Range: S113C, S114C 2 to 1600 MHz S331C, S332C 25 to 4000 MHz Frequency Accuracy (RF Source Mode) £75 parts per million @ 25°C* Frequency Resolution: S113C, S114C 10 kHz S331C, S332C 100 kHz 1.00 to 65.
Chapter 1 Table 1-2. General Information Performance Specifications (2 of 2) Spectrum Analyzer: Frequency Range S114C S332C Aging Accuracy S114C S332C 100 kHz to 1.6 GHz 100 kHz to 3.0 GHz Frequency Reference ±1 ppm/yr ±2 ppm Frequency Span 0 Hz (zero span) 100 kHz to 1.6 GHz 0 Hz (zero span) 100 kHz to 3.
Chapter 1 General Information Preventive Maintenance Site Master preventive maintenance consists of cleaning the unit and inspecting and cleaning the RF connectors on the instrument and all accessories. Clean the Site Master with a soft, lint-free cloth dampened with water or water and a mild cleaning solution. CAUTION: To avoid damaging the display or case, do not use solvents or abrasive cleaners. Clean the RF connectors and center pins with a cotton swab dampened with denatured alcohol.
Chapter 1 General Information InstaCal Module The Anritsu InstaCal module can be used in place of discrete components to calibrate the Site Master. The InstaCal module can be used to perform an Open, Short and Load (OSL) calibration procedure. Calibration of the Site Master with the InstaCal takes approximately 45 seconds (see Calibration, page 3-2). Unlike a discrete calibration component, the InstaCal module can not be used at the top of the tower to conduct load or insertion loss measurements.
Chapter 1 General Information Table 1-2. Anritsu Service Centers UNITED STATES CHINA KOREA ANRITSU COMPANY ANRITSU (SHANGHAI) ACSH ANRITSU CORPORATION LTD. 685 Jarvis Drive 2F, Rm. B, 52 Section Factory Building #901 Daeo Bldg. 26-5 Morgan Hill, CA 95037-2809 No.
Chapter 2 Functions and Operations Introduction This chapter provides a brief overview of the Site Master functions and operations, providing the user with a starting point for making basic measurements. For more detailed information, refer to Chapter 4, Measurements and Chapter 7, Software Tools. The Site Master is designed specifically for field environments and applications requiring mobility.
Chapter 2 Functions and Operations Front Panel Overview The Site Master menu-driven user interface is easy to use and requires little training. Hard keys on the front panel are used to initiate function-specific menus. There are four function hard keys located below the display, Mode, Frequency/Distance, Amplitude and Sweep. There are seventeen keypad hard keys located to the right of the display. Twelve of the keypad hard keys perform more than one function, depending on the current mode of operation.
Chapter 2 Functions and Operations Function Hard Keys MODE Opens the mode selection box (below). Use the Up/Down arrow key to select a mode. Press the ENTER key to implement. MEASUREMENT MODE FREQ - SWR RETURN LOSS CABLE LOSS - ONE PORT DTF - SWR RETURN LOSS POWER MONITOR SPECTRUM ANALYZER Figure 2-2. Mode Selection Box FREQ/DIST Displays the Frequency or Distance to Fault softkey menus depending on the measurement mode.
Chapter 2 Functions and Operations Keypad Hard Keys This section contains an alphabetical listing of the Site Master front panel keypad controls along with a brief description of each. More detailed descriptions of the major function keys follow. The following keypad hard key functions are printed in black on the keypad keys. 0-9 These keys are used to enter numerical data as required to setup or perform measurements.
Chapter 2 Functions and Operations The following keypad hard key functions are printed in blue on the keypad keys. Turns the liquid crystal display (LCD) back-lighting ON or OFF. (Leaving back lighting off conserves battery power.) LCD Contrast adjust. Use the Up/Down arrow key and ENTER to adjust the display contrast. AUTO SCALE Automatically scales the display for optimum resolution. LIMIT Displays the limit line menu for the current operating mode.
Chapter 2 Functions and Operations Soft Keys Each keypad key opens a set of soft key selections. Each of the soft keys has a corresponding soft key label area on the display. The label identifies the function of the soft key for the current Mode selection. Figures 2-3 through 2-7 show the soft key labels for each Mode selection.
Chapter 2 Functions and Operations MODE=DTF: FREQ/DIST AMPLITUDE SWEEP SOFTKEYS: D1 TOP RESOLUTION D2 BOTTOM SINGLE SWEEP TRACE MATH DTF AID TRACE OVERLAY 130 259 517 MORE ON/OFF LOSS SELECT TRACE PROP VEL CABLE WINDOW TOP OF LIST PAGE UP BACK PAGE DOWN BACK BOTTOM OF LIST DELETE TRACE DELETE ALL TRACE Figure 2-4.
Chapter 2 Functions and Operations MODE=SPECTRUM ANALYZER: SOFTKEYS: FREQ/DIST AMPLITUDE CENTER REF LEVEL SPAN SCALE START ATTEN STOP UNITS EDIT AUTO FULL GHz GHz dBm MANUAL SPAN UP 1-2-5 MHz dBV EDIT SPAN DOWN 1-2-5 kHz dBmV Hz dBuV ZERO MHz kHz Hz BACK BACK BACK Figure 2-5.
Chapter 2 Functions and Operations MODE=SPECTRUM ANALYZER: SOFTKEYS: AUTO SWEEP ON/OFF RBW SELECT ANTENNA METHOD VBW % POSITIVE PEAK MAX HOLD dBc AVERAGE CONT/ SINGLE MANUAL NEGATIVE PEAK MEASURE BACK MEASURE EDIT TRACE BACK BACK FIELD STRNGTH BACK RESET A OBW A®B DETECTION A-B ® A AVERAGE (1-25) A+B ® A CHANNEL POWER TRACE B ACP BACK CENTER FREQ CENTER FREQ INT BW MAIN CHANNEL BW CHANNEL SPAN ADJ CHANNEL BW CHANNEL SPACING MEASURE MEASURE BACK BACK Figure 2-7.
Chapter 2 Functions and Operations FREQ/DIST Displays the frequency and distance menu depending on the measurement mode. Frequency Menu Provides for setting sweep frequency end points when FREQ mode is selected. Selected frequency values may be changed using the keypad or Up/Down arrow key. q F1 — Opens the F1 parameter for data entry. This is the start value for the frequency sweep. Press ENTER when data entry is complete. q F2 — Opens the F2 parameter for data entry.
Chapter 2 Functions and Operations Choosing FREQ/DIST in Spectrum Analyzer mode causes the soft keys, below, to be displayed and the corresponding values to be shown in the message area. ¾ Sets the center frequency of the Spectrum Analyzer display . Enter a value using the Up/Down arrow key or keypad, press ENTER to accept, ESCAPE to restore previous value. q CENTER ¾ Sets the user-defined frequency span. Use the Up/Down arrow key or keypad to enter a value in MHz. Also brings up FULL and ZERO softkeys.
Chapter 2 Functions and Operations AMPLITUDE Displays the amplitude or scale menu depending on the measurement mode. Amplitude Menu Provides for changing the display scale. Selected values may be changed using the Up/Down arrow key or keypad. Choosing AMPLITUDE in FREQ or DTF measurement modes causes the soft keys, below, to be displayed and the corresponding values to be shown in the message area. q TOP — Opens the top parameter for data entry and provides for setting the top scale value.
Chapter 2 Functions and Operations SWEEP Displays the Sweep function soft key menu for the current operating mode. Sweep Menu Provides for changing the display resolution, single or continuous sweep, and access to the Trace Math functions. Choosing SWEEP in FREQ or DTF measurement modes causes the soft keys below to be displayed. q RESOLUTION — Opens the display to change the resolution. Choose 130, 259, or 517 data points. (In DTF mode, resolution can be adjusted through the DTF-AID table.
Chapter 2 Functions and Operations q AVERAGE (1-25) — The display will be an average of the number of sweeps specified here. For example, if the number four is entered here, the data displayed will be an average of the four most recent sweeps. q CHANNEL POWER — Activates Channel Power measurement. Channel power is measured in dBm. Channel Power density is measured in dBm/Hz.
Chapter 2 Functions and Operations Power Monitor Menu Selecting POWER MONITOR from the Mode menu causes the soft keys, described below, to be displayed and the corresponding values shown in the message area. q UNITS — Toggles between dBm and Watts. q REL — Turns relative mode OFF, if currently ON. If relative mode is currently OFF, turns it ON and causes the power level to be measured and saved as the base level. Subsequent measurements are then displayed relative to this saved value.
Chapter 2 Functions and Operations MARKER Choosing MARKER causes the soft keys, below, to be displayed and the corresponding values to be shown in the message area. Selected frequency marker or distance marker values may be changed using the keypad or Up/Down arrow key. q M1 — Selects the M1 marker parameter and opens the M1 marker second level menu. q ON/OFF q EDIT — Turns the selected marker on or off. — Opens the selected marker parameter for data entry.
Chapter 2 Functions and Operations q ON/OFF q EDIT — Turns the selected marker on or off. — Opens the selected marker parameter for data entry. Press ENTER when data entry is complete or ESCAPE to restore the previous value. q PEAK BETWEEN M3 & M4 — Places the selected marker at the peak between marker M3 and marker M4. q VALLEY BETWEEN M3 & M4 — Places the selected marker at the valley between marker M3 and marker M4. q BACK LIMIT — Returns to the Main Markers Menu.
Chapter 2 Functions and Operations SEGMENT 1 SEGMENT 2 SEGMENT 3 SEGMENT 4 SEGMENT 5 BACK q LIMIT BEEP SYS — Turns the audible limit beep indicator on or off. Displays the System menu softkey selections. q OPTIONS q UNITS — Displays a second level of functions: — Select the unit of measurement (English or metric). q PRINTER — Displays a menu of supported printers. Use the Up/Down arrow key and ENTER key to make the selection. q FIXED CW — Toggles the fixed CW function ON or OFF.
Chapter 2 Functions and Operations Symbols Table 2-1 provides a listing of the symbols used as condition indicators on the LCD display. Table 2-1. LCD Icon Symbols Icon HOLD ò dx T Symbol Site Master is in Hold for power conservation. To resume sweeping, press the RUN/HOLD key. After 10 minutes without a key press, the Site Master will automatically activate the power conservation mode. Integrator Failure. Intermittent integrator failure may be caused by interference from another antenna.
Chapter 2 Functions and Operations Table 2-2. Self Test Error Messages Error Message Description BATTERY LOW Battery voltage is less than 9.5 volts. Charge battery. If condition persists, call your Anritsu Service Center. EXTERNAL POWER LOW External supply voltage is less than 12.5 volts. Call your Anritsu Service Center PLL FAILED Phase-locked loops failed to lock. Charge battery.
Chapter 2 Functions and Operations Range Errors A listing of Range Error messages is given in Table 2-3. Table 2-3. Range Error Messages (1 of 2) Description Error Message RANGE ERROR:F1 > F2 The start (F1) frequency is greater than the stop (F2) frequency. RANGE ERROR:D1 > D2 The start (D1) distance is greater than the stop (D2) distance. RANGE ERROR:D2 > DMax=xx.x ft (m) The stop distance (D2) exceeds the maximum unaliased range.
Chapter 2 Functions and Operations Table 2-3. Range Error Messages (2 of 2) Description Error Message CANNOT ZERO NO DETECTOR INSTALLED Attempting to perform a Power Monitor zero adjust function with no RF detector connected to the Site Master. CANNOT ZERO INPUT SIGNAL TOO HIGH Attempting to perform a Power Monitor zero adjust function with an input of greater than –20 dBm. POWER MONITOR OPTION NOT INSTALLED Attempting to enter Power Monitor mode with no Option 5 installed.
Chapter 2 Functions and Operations A listing of InstaCal error messages is given in Table 2-4. Table 2-4. InstaCal Error Messages Error Message Description FAILED TO READ SERIAL NUMBER OF INSTACAL MODULE The Site Master was unable to read the InstaCal module serial number. FAILED TO SUCCESSFULLY TRANSFER INSTACAL MODULE DATA TO SITE MASTER The Site Master was unable to transfer all necessary data between the InstaCal module and the Site Master.
Chapter 2 Functions and Operations Battery Information Charging a New Battery The NiMH battery supplied with the Site Master has already completed three charge and discharge cycles at the factory and full battery performance should be realized after your first charge. NOTE: The battery will not charge if the battery temperature is above 45° C or below 0° C. Charging the Battery in the Site Master The battery can be charged while installed in the Site Master. Step 1. Turn the Site Master off. Step 2.
Chapter 2 Functions and Operations The NiMH battery will last longer and perform better if allowed to completely discharge before recharging. For maximum battery life, it is recommended that the NiMH battery be completely discharged and recharged once every three months. Battery Charge Indicator When the AC-DC adapter is unplugged from the Site Master, the battery indicator symbol will be continuously displayed at the top left corner of the Site Master display (Figure 2-8). BATTERY INDICATOR Figure 2-8.
Chapter 2 Functions and Operations The battery can be charged and discharged 300 to 500 times, but it will eventually wear out. The battery may need to be replaced when the operating time between charging is noticeably shorter than normal. Important Battery Information · With a new NiMH battery, full performance is achieved after three to five complete charge and discharge cycles. The NiMH battery supplied with the Site Master has already completed three charge and discharge cycles at the factory.
Chapter 3 Getting Started Introduction This chapter provides a brief overview of the Anritsu Site Master. The intent of this chapter is to provide the user with a starting point for making basic measurements. Power On Procedure The Anritsu Site Master is capable of up to 2.5 hours of continuous operation from a fully charged, field-replaceable battery. Built-in energy conservation features allow battery life to be extended over an eight-hour workday. The Site Master can also be operated from a 12.
Chapter 3 Getting Started Select the Frequency or Distance Regardless of the calibration method used, the frequency range for the desired measurements must be set before calibrating the Site Master. The following procedure selects the frequency range for the calibration. Step 1. Press the FREQ/DIST key. Step 2. Press the F1 soft key. Step 3. Enter the desired start frequency using the key pad or the Up/Down arrow key. Step 4. Press ENTER to set F1 to the desired frequency. Step 5. Press the F2 soft key.
Chapter 3 Getting Started Calibration Verification During the calibration process in Return Loss mode, either with discrete calibration components or with the InstaCal module, there are typical measurement levels expected. Verifying the measurement levels displayed on the screen during calibration can save valuable time in the field.
Chapter 3 Getting Started Manual Calibration Procedure If the “CAL OFF” message is displayed, or the test port cable has been changed, a new calibration is required. The following procedure details how to perform the calibration. OPEN SHORT CALIBRATION LOAD TEST PORT CABLE (OPTIONAL) RFOUT/REFLECTION TEST PORT Site Master S332C 1 2 START CAL AUTO SCALE SAVE SETUP RECALL SETUP 3 5 LIMIT 7 SAVE DISPLAY 9 ON OFF MODE Figure 3-2.
Chapter 3 Getting Started InstaCal Module Verification Verifying the InstaCal module before any line sweeping measurements is critical to the measured data. InstaCal module verification identifies any failures in the module due to circuitry damage or failure of the control circuitry. This test does not attempt to characterize the InstaCal module, which is performed at the factory or the service center. The performance of the InstaCal module can be verified by the Termination method or the Offset method.
Chapter 3 Getting Started InstaCal Module Calibration Procedure The InstaCal module automatically calibrates the Site Master using the OSL method. NOTE: The InstaCal module is not a discrete calibration component and it can not be used at the top of the tower to perform line sweep measurements. Check that the “CAL OFF” message is displayed in the upper left corner of the display. This indicates that the Site Master has not been calibrated.
Chapter 3 Getting Started Setting the Scale Auto Scale The Site Master can automatically set the scales to the minimum and maximum values of the measurement on the y-axis of the display. This function is particularly useful for measurements in SWR mode. To automatically set the scales: Step 1. Press the AUTO SCALE key. The Site Master will automatically set the top and bottom scales to the minimum and maximum values of the measurement on the y-axis of the display.
Chapter 3 Getting Started Recalling a Setup The following procedure recalls a setup from memory. Step 1. Press the RECALL SETUP key. Step 2. Select the desired setup using the Up/Down arrow key. Step 3. Press ENTER to recall the setup. Save and Recall a Display Saving a Display The following procedure saves a display to memory. Step 1. Press the SAVE DISPLAY key to activate the alphanumeric menu for trace storage. Step 2. Use the soft keys to enter a label for the saved trace.
Chapter 3 Getting Started Set the Distance and Cable Type In Distance-To-Fault (DTF) mode, the length of the transmission line (distance) and cable type are selected. The cable type determines the velocity propagation and cable attenuation factor. The following procedure can be used to set the distance and select the appropriate cable type. NOTE: Selecting the correct cable is very important for accurate measurements and for identifying faults in the transmission line.
Chapter 3 Getting Started Printing Printing is accomplished by selecting an available printer and pressing the print key as described below. Refer to the particular printer operating manual for specific printer settings. Printing a Screen Step 1. Connect the printer as shown in Figure 3-4.
Chapter 3 Getting Started Step 4. Press the PRINTER soft key and select from the displayed menu of supported printers. Step 5. Press the PRINT key. (Figure 3-6). PRINTER Site Master S332C ESCAPE CLEAR 2 1 PRINTER START CAL AUTO SCALE SAVE SETUP RECALL SETUP 3 CHANGE DATE 4 6 5 LIMIT MARKER SAVE DISPLAY RECALL DISPLAY 9 ON OFF MODE Figure 3-6-. FREQ/DIST ENTER 8 7 0 PRINT RUN HOLD +/- PRINT .
Chapter 3 Getting Started Using the Soft Carrying Case The soft carrying case has been designed such that the strap can be unsnapped to allow the case to be easily oriented horizontally; thus allowing the Anritsu controls to be more easily accessed (Figure 3-7). Figure 3-7.
Chapter 4 Cable & Antenna Measurements Introduction This chapter provides a description of cable and antenna measurements, including line sweeping fundamentals and line sweeping measurement procedures, available when the Site Master is in frequency or DTF mode. Line Sweep Fundamentals In wireless communication, the transmit and receive antennas are connected to the radio through a transmission line. This transmission line is usually a coaxial cable or waveguide.
Chapter 4 Cable & Antenna Measurements The performance of a transmission feed line system may be effected by excessive signal reflection and cable loss. Signal reflection occurs when the RF signal reflects back due to an impedance mismatch or change in impedance caused by excessive kinking or bending of the transmission line. Cable loss is caused by attenuation of the signal as it passes through the transmission line and connectors.
Chapter 4 Cable & Antenna Measurements Typical Line Sweep Test Procedures This section provides typical line sweep measurements used to analyze the performance of a transmission feed line system. System Return Loss Measurement System return loss measurement verifies the performance of the transmission feed line system with the antenna connected at the end of the transmission line.
Chapter 4 Cable & Antenna Measurements Figure 4-2 is an example of a typical system return loss trace: Figure 4-2. Typical System Return Loss Trace NOTE: The system sweep trace should appear at an approximate return loss of 15 dB (±3 dB) on the display. In general, a 15 dB return loss is measured in the passband of the antenna system. Insertion Loss Measurement The transmission feed line insertion loss test verifies the signal attenuation level of the cable system in reference to the specification.
Chapter 4 Cable & Antenna Measurements Step 3. Set the start and stop frequencies, F1 and F2, as described on page 3-2. Step 4. Connect the Test Port Extension cable to the RF port and calibrate the Site Master as described on page 3-2. Step 5. Save the calibration set up (page 3-7). Step 6. Connect the Device Under Test to the Site Master phase stable Test Port Extension cable. A trace will be displayed on the screen as long as the Site Master is in sweep mode. Step 7.
Chapter 4 Cable & Antenna Measurements Figure 4-3 is an example of a typical transmission line cable loss trace. Figure 4-3. Typical Transmission Line Cable Loss Trace Procedure - Return Loss Mode Step 1. Press the MODE key. Step 2. Select FREQ-RETURN LOSS using the Up/Down arrow key and press ENTER. Step 3. Set the start and stop frequencies, F1 and F2, as described on page 3-2. Step 4. Connect the Test Port Extension cable to the RF port and calibrate the Site Master as described on page 3-2. Step 5.
Chapter 4 Cable & Antenna Measurements Figure 4-4 is an example of a typical insertion loss measurement in return loss mode. Figure 4-4.
Chapter 4 Cable & Antenna Measurements Distance-To-Fault (DTF) Transmission Line Test The Distance-To-Fault transmission line test verifies the performance of the transmission line assembly and its components and identifies the fault locations in the transmission line system. This test determines the return loss value of each connector pair, cable component and cable to identify the problem location. This test can be performed in the DTF–RETURN LOSS or DTF–SWR mode.
Chapter 4 Cable & Antenna Measurements Figure 4-5 shows an example of a typical DTF return loss trace. Figure 4-5. Typical DTF Return Loss Trace In the above example: q Marker M1 marks the first connector, the end of the Site Master phase stable Test Port Extension cable. q Marker M2 marks the first jumper cable. q Marker M3 marks the end of the main feeder cable. q Marker M4 is the load at the end of the entire transmission line.
Chapter 4 Cable & Antenna Measurements Antenna Subsystem Return Loss Test Antenna Subsystem return loss measurement verifies the performance of the transmit and receive antennas. This measurement can be used to analyze the performance of the antenna before installation. The antenna can be tested for the entire frequency band, or tested to a specific frequency range. Transmit and receive frequency measurements are conducted separately.
Chapter 4 Cable & Antenna Measurements The following trace is an example of an antenna return loss trace. Figure 4-6. Antenna Return Loss Trace Calculate the threshold value and compare the recorded Lowest Return Loss to the calculated threshold value. Maximum Return Loss = -20 log (VSWR - 1) (VSWR + 1) NOTE: VSWR is the antenna manufacturer’s specified VSWR. If the measured return loss is less than the calculated threshold value, the test fails and the antenna must be replaced.
Chapter 5 Spectrum Analyzer Measurements Introduction This chapter provides a description of field measurements available when the Model S114C or S332C Site Master is in Spectrum Analyzer mode. Occupied Bandwidth A common measurement performed on radio transmitters is that of occupied bandwidth (OBW). This measurement calculates the bandwidth containing the total integrated power occupied in a given signal bandwidth.
Chapter 5 Spectrum Analyzer Measurements Step 10. Press the MEAS key to initiate actual measurement. The Site Master will display the measurement results in the display area. The Site Master default value for the % method is 99%, and N dBc down is 3 dB down. The table below provides typical instrument settings for measuring a CW and an IS-95 CDMA signal. Table 5-1.
Chapter 5 Spectrum Analyzer Measurements Procedure Using the test port extension cable and 30 dB attenuator, connect the Site Master to the RF_IN test port. The measurement can be accomplished with or without the 30 dB attenuator. The attenuator is recommended for additional protection. Step 1. Press the ON/OFF key on the Site Master. Step 2. Press the MODE key. Step 3. Use the Up/Down arrow key to select the Spectrum Analyzer mode and press ENTER. Step 4.
Chapter 5 Spectrum Analyzer Measurements Adjacent Channel Power Measurement Another common transmitter measurement is that of adjacent channel power ratio. This is defined as the ratio of the amount of leakage power in an adjacent channel to the total transmitted power in the main channel. The current trend is to use this measurement to replace the traditional two-tone intermodulation distortion (IMD) test for system non-linear behavior.
Chapter 5 Spectrum Analyzer Measurements Step 3. Press the MODE key. Step 4. Use the Up/Down arrow key to select the Spectrum Analyzer mode and press ENTER. Step 5. Select the appropriate reference level, input attenuation level, resolution bandwidth, and video bandwidth. Step 6. Press the MEAS key. Step 7. Once in the MEAS menu, press the ACP soft key. Step 8. Select the center frequency by pressing the CENTER FREQ soft key and enter the desired center frequency. Step 9.
Chapter 5 Spectrum Analyzer Measurements Out-of-Band Spurious Emission Measurements Out-of-band spurious measurements are made on signals outside the system main band. These signals, which can interfere with other communication systems, can be categorized into harmonics and random spurious emissions. Real time monitoring of spurious emissions from a transmitter can uncover unwanted signals before they interfere with other users on the other channels.
Chapter 5 Spectrum Analyzer Measurements In-Band/Out-of-Channel Measurements The in-band/out-of-channel measurements are those measurements that measure distortion and interference within the system band, but outside of the transmitting channel. These measurements include in-band spurious emissions and adjacent channel power ratio (also known as spectral regrowth). There are stringent regulatory controls on the amount of interference that a transmitter can spill to neighboring channels.
Chapter 5 Spectrum Analyzer Measurements Field Strength Measurement The procedure below details steps required making a field strength measurement with the Site Master. Required Equipment q Site Master Model S114C or S332C with tracking generator option q Antenna of your choice Procedure Step 1. Press the ON/OFF key on the Site Master. Step 2. Use the antenna editor feature of the Site Master Software Tools to define an antenna. Step 3. Upload the antenna information to the Site Master. Step 4.
Chapter 5 Spectrum Analyzer Measurements Antenna Calculations The following is a list of various antenna calculations should you find it necessary to convert from one to another: Conversion of signal levels from mW to mV in a 50-ohm system: 2 P=V R where: P = power in Watts V = voltage level in Volts R = resistance in Ohms -3 -6 For power in milliwatts (10 W), and voltage in microvolts (10 V): VdB(mV ) = P( dBm) + 107 Power density to field strength.
Chapter 6 Power Measurement Introduction The Site Master with Option 5 installed can be used for making power measurements with a broadband (1 MHz to 3000 MHz) RF detector, Anritsu P/N 5400-71N50. The power monitor displays the measured power results in dBm or Watts.
Chapter 6 Power Measurement Displaying Relative Power Step 9. With the desired base power level input to the Site Master, press the REL soft key. The message area will show REL: ON and the power reading will indicate 100%. Step 10. Press the UNITS soft key to display power in dBm. Since REL is ON, the power reading will be in dBr, relative to the base power level.
Chapter 7 Site Master Software Tools Introduction This chapter provides a description of the Site Master Software Tools provided with the Site Master. Site Master Software Tools (SMST) is a Windows 95/98/2000/ME/NT4 program for cable and antenna trace analysis. The program help function provides on screen instructions on display modification, trace overlay, and multiple plot printing.
Chapter 7 Software Tools Program Installation To install the Site Master Software Tools program: Step 1. Insert the Anritsu Site Master Software Tools disk in the CDROM drive. Step 2. From the Windows Start menu, select Run . Step 3. Type: X:\Setup.exe where X is the drive letter of your CDROM drive. Step 4. When prompted, press the Enter key to accept the default directory C:\Program Files\Site Master Software Tools and the installation will begin. Step 5.
Chapter 7 Software Tools Program Interface Cable Installation Communication between the Site Master and the PC is accomplished over a null modem serial cable provided with the Site Master (Anritsu part number 800-441). Step 1. Install the null modem serial interface cable to the Serial Interface connector on the Site Master Test Connector Panel. Step 2. Connect the other end of the serial interface cable to the appropriate COM port connector on the PC. Step 3. Turn on both the Site Master and the PC.
Chapter 7 Software Tools Program Plot Capture To open the plot capture menus, select the capture icon on the button bar, or select the Capture drop down menu from the menu bar. Select Capture to Screen to download traces to the PC. Highlight a folder, or highlight individual traces within a folder, to be downloaded to the PC. The traces will appear on the PC display as they are downloaded. Plot Properties After downloading, certain plot properties and information can be modified.
Chapter 7 Software Tools Program Markers Markers M1 through M6 can be activated from the Plot Properties menu. The six active markers can be displayed on the plot to help identify faults from the line sweep data. Misc. The Miscellaneous tab allows adjustment of the Plot/Limit Line Width and the setting of the Plot Footer. Plot/Limit Line Width can be used when preparing reports for the carrier, service providers, and network operators where the trace data must be visible and legible for documentation.
Chapter 7 Software Tools Program Step 3. Exit the Site Master Software Tools program and open the target application (Microsoft Word, etc.). Step 4. Select Edit and then Paste. The file will be inserted as a low-resolution graphic file or a bitmap. Saving a Plot to a Spreadsheet Plots can be saved as a text file (.txt) which can then be imported into a spreadsheet program. To save a plot as a text file: Step 1. Select the trace to be copied with the mouse cursor. Step 2.
Chapter 7 Software Tools Program Uploading a Cable List After custom cable list has been created in Site Master Software Tools it can upload it to the Site Master. The serial communication null modem cable must be connected from the Site Master to the PC. In the Cable Editor, select Tools and Upload Cable List. The software will confirm the upload with a message " Upload Complete" when the operation is finished.
Chapter 7 Software Tools Program Uploading Antenna Factors To upload antenna information from Software Tools to the Site Master: Step 1. Connect the RS232 cable between the PC and the Site Master. Step 2. Click on the Upload button on the tool bar (or select Upload from the Tools menu). It is important to note that the Site Master must sweep very quickly during the data transfer, at least every 5 seconds, or the Software Tools program may “time-out.
Appendix A Reference Data Coaxial Cable Technical Data Table A-1 provides a standard listing of common coaxial cables along with their Relative Propagation Velocity and Nominal Attenuation values in dB/m @1000, 2000, and 2500 MHz. (N/A indicates that the specification is not applicable to the listed cable.) Table A-1. Coaxial Cable Technical Data (1 of 3) Manufacturer Cable Type Relative Propagation Velocity (Vf) Andrew FSJ1-50A 0.84 Nominal Attenuation dB/m @ 1000 MHz 0.
Appendix A Reference Data Table A-1. Coaxial Cable Technical Data (2 of 3) Manufacturer Cable Type Relative Propagation Velocity (Vf) Cablewave HCC12-50J 0.915 Nominal Attenuation dB/m @ 1000 MHz 0.087 Cablewave HCC78-50J 0.915 0.041 0.061 0.066 Cablewave HCC158-50J 0.95 0.022 0.031 0.033 Cablewave HCC300-50J 0.96 0.015 N/A N/A Cablewave HCC312-50J 0.96 0.013 N/A N/A Cablewave HF 4-1/8” Cu2Y 0.97 0.01 N/A N/A Cablewave HF 5” Cu2Y 0.96 0.
Appendix A Reference Data Table A-1. Coaxial Cable Technical Data (3 of 3) Nominal Attenuation dB/m @ 1000 MHz Nominal Attenuation dB/m @ 2000 MHz Nominal Attenuation dB/m @ 2500 MHz Manufacturer Cable Type Relative Propagation Velocity (Vf) NK Cables RF 2 ¼” -50 BHF 0.88 0.021 0.034 N/A NK Cables RFF 3/8” -50 0.81 0.147 0.218 0.25 NK Cables RFF 3/8” -50 GHF 0.81 0.147 0.218 0.25 NK Cables RFF 3/8” -50 BHF 0.81 0.147 0.218 0.25 NK Cables RFF ½” -50 0.82 0.112 0.167 0.
Appendix B Windowing Introduction The Distance sub-menu (page 2-10) provides for setting the cable loss and relative propagation velocity of the coaxial cable. The WINDOW key opens a menu of FFT windowing types for the DTF calculation. The theoretical requirement for inverse FFT is for the data to extend from zero frequency to infinity. Side lobes appear around a discontinuity due to the fact that the spectrum is cut off at a finite frequency.
Appendix B Windowing D is ta n c e T o F a u lt -5 -1 0 -1 5 -2 0 -2 5 -3 0 R e tu rn L o s s (d B ) -3 5 -4 0 -4 5 -5 0 1 0 5 Figure B-2. 1 5 2 0 2 5 3 0 F e e t 3 5 4 0 4 5 5 0 5 5 6 0 4 0 4 5 5 0 5 5 6 0 Nominal Side Lobe Windowing Example D is ta n c e T o F a u lt -5 -1 0 -1 5 -2 0 -2 5 -3 0 R e tu rn L o s s (d B ) -3 5 -4 0 -4 5 -5 0 5 Figure B-3.
Appendix B Windowing D is ta n c e T o F a u lt -5 -1 0 -1 5 -2 0 -2 5 -3 0 R e tu rn L o s s (d B ) -3 5 -4 0 -4 5 -5 0 5 Figure B-4.