
User`s manual


31
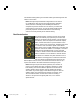
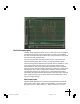
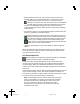
The Pitch Graph Display
The Pitch Graph displays the pitch contour of the audio to be processed as
well as the target pitch contour objects that you create. On this display,
the vertical axis represents pitch (with higher notes towards the top) while
the horizontal axis represents time.
The red curve represents the original pitch contour of the input track,
while the desired target pitch or pitch contour is indicated in yellow.
The horizontal grid lines represent scale pitches. The key annotation, scale
name, scale pitches and Scale Detune value are those defined in the
Automatic Mode. They do not affect the computations of the Graphical
Mode in any way. They are merely a reference to guide you in drawing the
target pitches. If you wish to change them, select the Automatic Mode
and change the Key pop-up, Scale pop-up, or the Scale Detune setting,
respectively. (Changing the Scale Detune setting will also result in the scale
pitch graph lines moving up or down relative to the tracked pitch.) Then,
return to Graphical Mode.
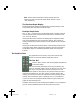
Pitch Graph Scale
The Pitch Graph Scale Buttons control the horizontal (time) and vertical
(pitch) scaling of the graph. Clicking the appropriate “+” button causes
the view to zoom in, while clicking a “-” button causes it to zoom out.
01-39 AT3 man layout RGB 03/05/2001, 1:31 pm31