
User`s manual


32
Note: The horizontal scale buttons always control the Pitch
Graph. They also control the Envelope Graph when it is set to
“Tie” (see below).
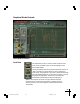
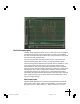
The Envelope Graph Display
The Envelope Graph displays the amplitude (loudness) envelope of the
sound whose pitch is shown in the Pitch Graph.
Envelope Graph Scale
The “+” and “-” buttons next to the Envelope Graph control the vertical
scale as expected, while the horizontal (time) scale is controlled by the
“All” and “Tie” buttons.
Clicking the All button causes the envelope graph to display the entire
time scale represented by the current buffer setting. This is useful for
locating and selecting various portions of audio spread over the duration
of a song.
Clicking the Tie button slaves the position of the Envelope Graph to that
of the Pitch Graph. When this setting is selected, the horizontal scale of
the Envelope Graph is controlled by the Pitch Graph horizontal scale
buttons.
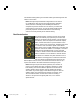
The Graphical Tools
The graphical tools are used in conjunction with the edit
buttons to create the desired target pitch contour.
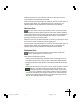
The Line Tool
The Line Tool is used to draw multi-segment straight lines
on the Pitch Graph.
Start the process by selecting the Line Tool and clicking any-
where on the Pitch Graph to set an anchor point. As you move
the cursor, a line will extend from the anchor point to the
cursor position. Click again to set a second anchor point and
define the first segment of your pitch contour. Continue clicking and
defining lines until your contour is complete. End the process by double-
clicking on the final anchor point or pressing <esc> on your keyboard.
If you move the cursor outside the Pitch Graph during point entry, the
graph will automatically scroll.
To delete the last anchor point entered, press <delete> on your keyboard
(you can do this repeatedly back to the very first anchor point).
01-39 AT3 man layout RGB 03/05/2001, 1:31 pm32