Version 4.
Preface Copyright © Copyright APC Corp. 2001-2007 Trademarks APC, BotzWare, InfraStruXure, InfraStruXure Central, NetBotz, RackBotz, WallBotz, and the NetBotz symbol are registered trademarks of APC Corp. Other brand and product names are registered trademarks or trademarks of their respective holders.
Preface 2 InfraStruXure Central 4.
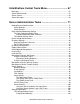
Contents Preface..............................................................................1 Introduction.................................................................... 11 Managing Additional Devices.................................................................................... 11 Upgrading InfraStruXure Central .............................................................................. 11 About the Installer CD ...................................................
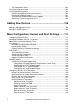
Predefined Groups .............................................................................................. 33 Setting Up Device Security Settings ......................................................................... 33 Starting the Device Security Settings Task ......................................................... 34 Creating Device Security Settings Configurations............................................... 34 Discovering Your Devices........................................................
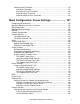
InfraStruXure Central Tools Menu............................... 67 Messages ................................................................................................................. 67 Server Administration ............................................................................................... 67 Server Control .......................................................................................................... 68 Server Messages..........................................................
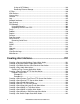
The Repositories Pane ...................................................................................... 103 Surveillance Administration..................................................................................... 104 User/Group Administration...................................................................................... 104 Creating and Editing Local User Accounts ........................................................ 105 Creating and Editing Groups ....................................
Defining State Thresholds................................................................................. 147 Alert State Threshold ................................................................................... 147 Alert State for Time Threshold..................................................................... 149 State Mismatch Threshold ........................................................................... 151 State Mismatch for Time Threshold.................................................
Using an NFS Mount.................................................................................... 189 Removing External Storage ......................................................................... 190 IP Filter.................................................................................................................... 190 IPMI Devices........................................................................................................... 191 License Keys...................................
Using the Map View .................................................... 245 Editing Map Settings............................................................................................... 248 Creating Custom Maps ..................................................................................... 248 Changing the Map Background......................................................................... 248 Setting Icon Preferences............................................................................
Send Continuous During Alerts: Usage Examples....................................... 277 Send on Motion Detected .................................................................................. 277 Send on Motion Detected: Usage Examples ............................................... 277 Send on Motion Detected During Alerts ............................................................ 277 Send on Motion Detected During Alerts: Usage Examples.......................... 277 BotzWare Macros.................
Introduction InfraStruXure Central works with your APC NetBotz devices, APC devices, and other 3rd-party manufacturer devices to provide a comprehensive monitoring solution for your IT environment and equipment. With InfraStruXure Central, you can instantly view environment readings and a camera image from any site on your network where an APC NetBotz device has been deployed.
Introduction 12 InfraStruXure Central 4.
About the Installer CD You can use the InfraStruXure Central Installer CD to install the following applications on any supported system: • InfraStruXure Central Console: A Java-based user interface designed to work with the InfraStruXure Central server. Simplifies monitoring and managing your NetBotz devices, APC devices, and other 3rd party devices.
About the Installer CD Minimal product features, or Custom product features. – If you choose Typical the Serial Configuration Utility, product documentation, and InfraStruXure Central Console application will be installed on your system. – If you choose Minimal only the Serial Configuration Utility and the InfraStruXure Central Console application will be installed on your system. – If you choose Custom you can select which components you want installed on your system. 5.
About the Installer CD Minimal product features, or Custom product features. – If you choose Typical the Serial Configuration Utility, product documentation, and InfraStruXure Central Console application will be installed on your system. – If you choose Minimal only the Serial Configuration Utility and the InfraStruXure Central Console application will be installed on your system. – If you choose Custom you can select which components you want installed on your system. 6.
About the Installer CD 16 InfraStruXure Central 4.
Installation and Configuration Installing your InfraStruXure Central Server The InfraStruXure Central server is designed to be installed in a server rack or cabinet. Rack mounting configurations differ depending on rack or cabinet design and manufacturer. Please refer to your rack or cabinet documentation for detailed instructions on how to mount equipment in your rack or cabinet. Note To configure the IP settings on your InfraStruXure Central server you will need to connect a Windows 2000, NT 4.
Installation and Configuration server you wish to configure and then click Next to continue configuring your server. Note If the COM port associated with the port to which your serial cable is connected is currently in use by another application, the message beside the COM port in the Owner column will indicate that the port is not currently available. To correct this, close the application that is using the COM port and then click Scan Serial Ports. 1. The Root Password window appears.
Installation and Configuration • System rack kits are intended to be installed in a rack by trained service technicians. If you install the kit in any other rack, be sure that the rack meets the specifications. Do not move racks by yourself. Due to the height and weight of the rack, a minimum of two people should accomplish this task. Caution • Before working on the rack, make sure that the stabilizers are secured to the rack, extended to the floor, and that the full weight of the rack rests on the floor.
Installation and Configuration Observe the following safety precautions when installing your system in the rack. Caution • When installing multiple systems in a rack, complete all of the procedures for the current system before attempting to install the next system. • Rack cabinets can be extremely heavy and move easily on the casters. The cabinet has no brakes. Use extreme caution while moving the rack cabinet. Retract the leveling feet when relocating the rack cabinet.
Installation and Configuration Installation Tasks Installing a rack kit involves performing the following tasks in their numbered order: 1. Removing the rack doors 2. Select an installation location within the rack 3. Installing the RapidRails slide assemblies in the rack 4. Installing the system in the rack 5. Installing the cable-management arm 6. Routing cables 7. Replacing the rack doors Removing the Rack Doors See the procedures for removing doors in the documentation provided with your rack cabinet.
Installation and Configuration below). 3. At the back of the cabinet, pull back on the mounting-bracket flange until the top mounting hook is in the top square hole, and then push down on the flange until the mounting hooks seat in the square holes and the push button pops out and clicks. 4. Repeat steps 1 through 3 for the slide assembly on the other side of the rack. Ensure that the slide assemblies are mounted at the same position on the vertical rails on each side of the rack.
Installation and Configuration system into position in front of the extended slides (see below). 2. Place one hand on the front-bottom of the system and the other hand on the back-bottom of the system. 3. Tilt the back of the system down while aligning the back shoulder screws on the sides of the system with the back slots on the slide assemblies. 4. Engage the back shoulder screws into their slots. 5.
Installation and Configuration Installing the Cable-Management Arm The cable-management arm can only be installed on the right side of the rack cabinet (as viewed from the back). Note To install the cable-management arm on the system, perform the following steps: 1. Facing the back of the rack cabinet, locate the latch on the end of the slide assembly. 2. Push the tab on the back end of the cable-management arm into the latch on the end of the slide assembly (see below). The latch clicks when locked. 3.
Installation and Configuration the indicator in its slot at the back end of the cable-management arm (see below). 7. Connect the power cords to their receptacles on the back panel (see below). Use the strain-relief loops (if available) on the back of the power supplies to provide strain relief for the power cables. Note Allow some slack in each cable as you route them around hinges in the cable-management arm. Caution 8.
Installation and Configuration panel. Caution If you will ne enabling the internal DHCP LAN functionality on your InfraStruXure Central, the private LAN connection must be connected to LAN Port 2. Once this feature is enabled, ensure that LAN Port 2 is NOT connected to a public LAN. Enabling this functionality on an InfraStruXure Central with LAN Port 2 connected to a public LAN will result in serious network connectivity issues.
Installation and Configuration stretch, or pinch with the movement of the cable-management arm. 12. Tighten the tie-wraps just enough to ensure that the cable slack is neither too tight to cause excessive pinching nor too loose, yet keep the cables from slipping as the system is moved in and out of the rack. Replacing the Rack Doors Refer to the procedures for replacing doors in the documentation provided with your rack.
Installation and Configuration 28 InfraStruXure Central 4.
Getting Started This Getting Started section is designed to help you become familiar with the InfraStruXure Central interface, and to guide you through the basic configuration and functionality of the InfraStruXure Central console. The procedures described in this section will enable you to configure InfraStruXure Central so that you can automatically discover, monitor, and manage physical infrastructure devices on your network.
Getting Started Logging Into InfraStruXure Central Point your web browser at the IP address or hostname of the InfraStruXure Central server. You will see the InfraStruXure Central welcome screen. You can use the InfraStruXure Central welcome page to launch the InfraStruXure Central console, install the InfraStruXure Central console, view an online version of this User’s Reference, view a list of help topics, view the InfraStruXure Central logs, or view the InfraStruXure Central server status.
Getting Started your console, check the Connect Using SSL check box. 5. Type in the User and Password fields the user ID and password for your InfraStruXure Central user account.
Getting Started The Device Selection pane functions as a status monitoring view for the currently selected device group. If a monitored device in the currently selected device group reports an alert, the device will turn red in the Device Selection pane. If the device has gone offline it will be “grayed out” and will have a large red X over its icon. This can be used to simplify troubleshooting and to quickly identify trouble spots. The Device Selection pane also supports filters.
Getting Started Pane View Description Graph/Report View Enables you to generate reports, for a user-specified time period, from the data collected from the sensor data collected by one or more devices. The data can be plotted in a Graph view to simplify data collation and comparison, or it can be can be collated into a single report to simplify data collation, collection, and comparison. Report data (or from a selected portion of the report) can be exported to a server and saved for future reference.
Getting Started By default, APC NetBotz devices come pre-configured with a Administrator user name (the default user name and password is apc/apc). However, you may have changed the user settings on your devices to enhance the security of your devices. The Device Security Settings task enables you to configure InfraStruXure Central with the Supervisor/ Administrator User ID and Password to use when accessing your devices.
Getting Started c. If you are using a port other than port 80 for device network communications, type in the Port field the port number in use. d. Type in the User ID field apc2. e. Type in the Password field apc2. f. Click OK to save this configuration. 3. Click the X in the upper right-hand corner of the window to close the Device Security Settings window.
Getting Started b. c. d. e. f. g. h. i. Select the Management device radio button and then click Next. Type in the IP Range field 192.168.2.*. Type in the Port Range field 100. Specify SSL Options. By default, Do not use SSL is selected. If desired, you can configure the Discovery Settings to use SSL if available, require SSL without verification, or require SSL with verification. Check the Enable schedule check box.
Getting Started devices on the 192.168.1.* subnet. a. Type in the Label field Devices on 192.168.1.*. b. Leave the Parent drop box set to All Devices (note that you can also nest device groups within other device groups, if desired). c. Select the Dynamic tab and then use the controls at the bottom of the window to build rules for this device group. d. Click More to add a new set of rules controls to the interface. e. Select IP address > equals and then type 192.168.1.* in the rules field. f.
Getting Started Creating User Accounts Use the selections available from the User/Group Administration task to create or modify local user accounts and local user groups for your InfraStruXure Central server. Local user accounts on your InfraStruXure Central server are allowed access only to specified device groups User/Group Administration also enables you to create local user groups. Local user groups are collections of local user accounts.
Getting Started a. b. c. d. e. f. g. h. i. The Create User window opens. Select the User Information tab. Check the Enabled check box. Type User2 in the User name field. Type User2’s name in the Full Name field. Type a password for User2 in the Password and Verify Password fields. Type User2’s e-mail address in the E-mail Address field. If desired, type additional information in the Description field. Select the User Roles tab.
Getting Started OK. 7. Click OK to save your local user group settings. Using Sensor Imaging Sensor Imaging enables you to see at a glance the general state of each of your devices. Once you have defined a range of values for the currently selected Display Sensor, the color of the device icon will change to reflect where it's current sensor reading falls in the display imaging range.
Getting Started If you want to change any of these settings for a sensor, simply select the sensor, specify new low and/or high values, and select new Sensor Imaging colors as desired. You can also use the slider control in the Transparency tab to adjust the transparency of the Sensor Imaging color blocks that appears behind the icon in the Map view. 4. When you are finished, click OK to save your new Sensor Imaging configuration. InfraStruXure Central 4.
Getting Started 42 InfraStruXure Central 4.
The InfraStruXure Central Console The InfraStruXure Central console is a stand-alone Java application that is used to access and manage the InfraStruXure Central server. Before you can use the InfraStruXure Central console you must first install the application using your InfraStruXure Central Installer CD-ROM. If you have already installed the InfraStruXure Central console, click Start > Programs > InfraStruXure Central Console > InfraStruXure Central Console to start the application.
The InfraStruXure Central Console Logging Into InfraStruXure Central You will next be prompted to choose a InfraStruXure Central server to which you will log in. If you have previously logged into a InfraStruXure Central server using this console you can simply select the IP address or host name of the server from the Server selection box. Otherwise: 1. Type the IP address or host name of the InfraStruXure Central server in the IP Address or Host Name field. 2.
The InfraStruXure Central Console Interface Navigation After you have logged in, you will see the InfraStruXure Central console. The InfraStruXure Central console is divided into three main regions, or panes. The upper-left corner pane is called the Device Group Navigation pane. The lower-left corner pane is called the Device Selection pane. Finally, the rightside pane is called the Action/Information pane.
The InfraStruXure Central Console The Action/Information Pane Located on the right-hand side of the interface, the Action/Information pane contains a series of buttons that enable you to view information and perform mass configuration tasks on the devices in the currently selected device group, or the devices that are currently selected in the Device Selection pane. Each button, when selected, presents a different view in the Action/Information pane.
The InfraStruXure Central Console Action Pane View Surveillance View Description A separately available license key-based upgrade designed for use with InfraStruXure Central. Surveillance View enables you to easily collate, index and view a summary of all surveillance event images that have been captured on a specified day or range of days.
The InfraStruXure Central Console To use the Map view, select a device group from the Device Group Navigation pane and then click the Map tab. The devices that are part of the selected device group appear in the Map view window. Each device is shown as an icon, along with a display name (IP address, location value, or hostname, depending on your Client Preferences), and a current sensor reading.
The InfraStruXure Central Console Context Menu Selection Description Delete device Deletes all selected devices. Note: Deleting a device purges all data associated with the device from the InfraStruXure Central database and also deletes the device from any other device groups in which it exists, including other device groups to which you may not have access. Improper use of this function could result in loss of data and could also impact other InfraStruXure Central users.
The InfraStruXure Central Console Context Menu Selection Description Edit Map Use the selections available from the Edit Map menu to create a custom map, delete a previously saved custom map, specify icon preferences, add a custom background image to your Map, and to specify sensor display preferences. For more information see “Editing Map Settings” on page 248. View Current Sensors Opens a window that displays the current sensor readings and image capture for the selected device.
The InfraStruXure Central Console Table View The InfraStruXure Central Table view presents all devices in the currently selected device group in an easy-to-monitor and read table display. Colors are used to indicate the current state of each device in the device group making alerts or offline devices easy to spot. You can also use Table Preferences to specify the data that is displayed for each device.
The InfraStruXure Central Console Context Menu Selection Description Delete Device Deletes all selected devices from the current Map. Note: Deleting a device purges all data associated with the device from the InfraStruXure Central database and also deletes the device from any other device groups in which it exists, including other device groups to which you may not have access. Improper use of this function could result in loss of data and could also impact other InfraStruXure Central users.
The InfraStruXure Central Console Alerts that contain picture data can also be viewed, provided that the alert has been posted to the InfraStruXure Central server using the device HTTP Post support (see “Creating a Send HTTP Post Alert Action” on page 235 for more information) or the Send to InfraStruXure Central alert action. If you select one or more devices from the Device Selection pane only the selected devices will be listed in the Alerts view.
The InfraStruXure Central Console Graph/Report View The InfraStruXure Central Graph/Report view enables you to generate reports, for a user-specified time period, from the data collected from the sensor data collected by one or more devices. The data can be plotted in a graph to simplify data collation and comparison, or it can be can be collated into a single report to simplify data collation, collection, and comparison.
The InfraStruXure Central Console each page of the resulting report or graph. 5. Select from the Graph interval drop box the time interval for which data will be included in the resulting report or graph. 6. Select from the Sensor tree the sensors for which data will be included in the resulting report or graph and then click the right arrow button to add the sensors to the list on the right. To remove sensors from the list, select them and then click the left arrow button. 7.
The InfraStruXure Central Console Mass Configuration View The InfraStruXure Central Mass Configuration view provides complete mass device configuration functionality, enabling you to perform all of the tasks necessary for complete management of all of your devices, one at a time or en masse. The Mass Configuration panel is divided into two areas: Sensors Settings and Device Settings. Each area features a number of icons that represent the mass configuration tasks that you can perform.
The InfraStruXure Central Console Using Filters You can use filters to quickly and easily limit the devices that are displayed in the Device Selection pane. Because the contents of the Device Selection pane determine what devices are displayed in the various Action/Information pane views (i.e. the Map, Table, Alert, Graph/Report, Mass Configuration, and Surveillance Views), by filtering the contents of the Device Selection pane you also filter the contents of all of the other panes as well.
The InfraStruXure Central Console select the desired filter and then click Edit. 3. The Add or Edit Filter window opens. This window contains the following controls: Field Filter name 58 Description The name that you will use to describe this filter. InfraStruXure Central 4.
The InfraStruXure Central Console Field Description Management device display filters These controls determine how management devices will be displayed in the filtered results.You can select from the following options: • Show all management devices: All management devices will be included in the filtered results. Docked pods, undocked pods, and devices connected to management devices via USB or network connections are shown. • Show no management devices: Management devices are filtered from the results.
The InfraStruXure Central Console b. Check the Treat values as regular expressions check box to enable greater control of wildcard value definitions in the additional filter controls. c. Define the filter. i. First select the type of device to which the filter applies (Management Device or Monitored Device). ii.Select the value that will be used to determine whether the device is included in the filtered results.
InfraStruXure Central Client Preferences Client preferences are configured using the Client Preferences interface, available using the Edit>Preferences menu selection. Use the Client Preferences interface to configure the following client settings: • Appearance • Colors • General • Network • User Account • Video Clip Player Note that these settings apply only to the currently logged in user account, and will not affect other user accounts or any global InfraStruXure Central settings.
InfraStruXure Central Client Preferences When you’re finished configuring your client appearance, click OK to save your settings. Configuring Color Preferences Enables you to configure the colors that will be used to indicate alert states on devices in the Map and Table view.
InfraStruXure Central Client Preferences Configuring General Client Preferences Enables you to specify a variety of general console settings. Use the controls to specify the following client preferences: • To specify the location in which your system’s web browser is installed, type in the Browser location field (or use click Browse and navigate to) the drive, directory, and executable name of your web browser.
InfraStruXure Central Client Preferences Type in the Connection timeout field the amount of time that the InfraStruXure Central console should wait when attempting to connect to the InfraStruXure Central server before giving up, and check the Direct connect for camera images check box if desired. Click OK to save your settings. 64 InfraStruXure Central 4.
InfraStruXure Central Client Preferences Configuring User Account Preferences Enables you to specify the password, e-mail address, and description that will be used for the InfraStruXure Central server's administrator account. The user name for this account is always “apc.” The default password is “apc” as well. To change the password: 1. Type in the Current password field the password that is currently assigned to the administrator account. 2.
InfraStruXure Central Client Preferences Configuring Video Clip Player Preferences Enables you to specify how many MB of disk space should be reserved for use with the built-in video clip player. Click OK to save your settings. 66 InfraStruXure Central 4.
InfraStruXure Central Tools Menu The selections available from the Tools menu enable you to view InfraStruXure Central server messages, configure settings on the InfraStruXure Central server, configure user accounts, configure network settings, and perform maintenance tasks on the server. Individual tasks are divided into one of the following submenus: Messages, Server Administration, Server Control, and Server Messages.
InfraStruXure Central Tools Menu Server Control Use the selections available from the Server Control submenu to restart the InfraStruXure Central application and device, or to shutdown and power off the device. You can choose from the following three selections: • Restart InfraStruXure Central Software: Shuts down and restart the InfraStruXure Central application on the InfraStruXure Central server.
InfraStruXure Central Tools Menu When you click View Server Messages in Web Browser you are prompted to log in using your InfraStruXure Central account User ID and Password. Once logged in, click on the log that you wish to view. Aside from the nbc.xml log, the log files are primarily for use by APC support staff. Note InfraStruXure Central 4.
InfraStruXure Central Tools Menu 70 InfraStruXure Central 4.
Server Administration Tasks Use the selections available from the Server Administration submenu to configure settings on the InfraStruXure Central server, configure user accounts, and perform maintenance tasks on the server.
Server Administration Tasks Server Backup The Server Backup pane contains a list of previously created backups entries. For detailed information about each of the previously created backup entries, select the backup entry file form the Backups selection list and then refer to the Backup Information data beneath the selection list. To create a new Backup entry, or to edit a previously created Backup entry: 1. Select the Server Backup pane and then click Create to add a new Backup entry.
Server Administration Tasks Field Description Domain — Windows systems only Type in this field the name of the domain on which the remote system that will be used to store the backup file resides. Share name — Windows systems only Type in this field the name of the share on the remote system on which the backup file will be stored. Share path — NFS mounts only The share path of the NFS mount.
Server Administration Tasks To restore your InfraStruXure Central server: 1. Select the Server Restore pane. This pane contains the following fields: Field Description Remote mount type Select the type of file system used by the remote networkattached storage system. You can choose either NFS or Windows. Note that the mount type you select alters the contents of this window. Serve hostname or IP address Type in this field the hostname used by the remote system.
Server Administration Tasks Avoiding Redundant Data Collection All data collection is performed on a device group-by-device group basis. Therefore, devices that appear in multiple device groups could have data collected from them at multiple times, depending on the Data Collection settings for each device group to which they belong.
Server Administration Tasks settings, the Edit Collection window opens). This window contains the following controls: Field Description Device Group Select from this drop box the name of the device group to which these data collection settings will apply. If you are editing a previously defined data collection setting the name of the device group to which the settings apply will appear in this field.
Server Administration Tasks group, the Edit Device Monitor Entry window opens). This window contains the following controls: Field Description Device Group Select from this drop box the name of the device group to which these device monitoring settings will apply. If you are editing a previously defined device monitoring configuration the name of the device group to which the settings apply will appear in this field.
Server Administration Tasks 1. Click Create (or, select a previously defined device group from the tree view and then click Edit). 2. Type in the Label field a name for this device group. 3. Select from the Parent drop box the previously created device group that will be the parent of the new device group. Note that nested device groups inherit the security privileges of their parents. 4.
Server Administration Tasks a selected or user-specified value for the appliance to be included in the device group. Finally, use the last control (an entry field or a drop box, depending on what value type you selected) to specify the value that InfraStruXure Central will check on the appliance to determine whether or not the appliance belongs in the device group.
Server Administration Tasks – Administrator access: The local user account or local user group are permitted to view Surveillance data generated by the devices in this group, and also have complete access to all Surveillance configuration tasks on the devices. Note The Device and Surveillance privilege levels specify the default access privileges for local users or local user groups that can access this device group.
Server Administration Tasks – Management devices: If you are creating a Management device discovery entry, the following controls are displayed in the Management device discovery definition window: Field Description IP range The range of IP addresses that will be searched periodically for devices. An IP address range is defined by either using an asterisk to indicate a wildcard portion of the IP address (for example, 192.168.1.
Server Administration Tasks Field Description Days The day or days of the week on which the discovery function will be performed. Time The time of day at which the discovery function will be performed. – SNMP devices: If you are creating an SNMP device discovery entry, the following controls are displayed in the SNMP device discovery definition window: Field 82 Description IP range The range of IP addresses that will be searched periodically for SNMP devices.
Server Administration Tasks Field Description Read community The read only community string used for SNMP communications on the target. The default value is public. 3. Type in the required information, and then click Finish to create the discovery entry. Running Discovery Processes Discovery processes run automatically according to the schedule you define. However, if you want to run a discovery process right away, select the discovery setting from the Discovery task window and then click Start.
Server Administration Tasks – AP7611 – AP7620 – AP7621 – AP7622 – AP7622N – AP7626 – AP7640 – AP7641 APC protocol PDU devices will be discovered only if they are connected to the internal DHCP LAN. APC protocol PDU devices that are connected to a public LAN will not be discovered. Note Disk Array Management Use the Disk Array Management task to check the status of the RAID array (included with Enterprise Edition InfraStruXure Central).
Server Administration Tasks 2. The Create/Edit window opens. Type in the Name (label) field a name for the export entry. 3. Select from the Type of server drop box that type of server to which data will be saved. You can select FTP, E-mail, HTTP, Windows, or NFS. 4. Fill in the server-type specific data fields. The fields that appear in the rest of the window depend on what server type has been selected from the Type of server drop box.
Server Administration Tasks • If you select E-mail from the Type of server drop box the following fields are available: Field Description Subject of message The subject of the e-mail message that will be generated and sent. Body of message The body of the message e-mail message that will be generated and sent. E-mail addresses E-mail addresses to which the e-mail message that will be generated and sent. To add e-mail addresses click Add.
Server Administration Tasks • If you select NFS from the Type of server drop box the following fields are available: Field Description Server hostname or IP The hostname or IP address of the NFS mount. Share path The path for the NFS share. Subdirectory (optional) The subdirectory in the NFS mount that will be used to store data. If no subdirectory is specified, data will be stored in the root directory of the mount. 5.
Server Administration Tasks To determine if upgrades are available for any of the package names listed in this pane, select the source from which upgrades and packages will be installed. • To compare the version of package names available from a CD against those that are available from your InfraStruXure Central server, click Browse to File and select the CD-ROM drive that contains your CD. Then, select the directory that contains the master.release file and click Open.
Server Administration Tasks Using the Job Status Pane If InfraStruXure Central attempts to configure a device that is in Post Only mode or that is presently offline or unreachable, the task will be placed in a pending state and will appear in the Pending Requests list. Jobs that were previously in a pending state but which have since been successfully completed appear in the Completed Requests list.
Server Administration Tasks To set the Post Only Camera Settings, select the radio button that corresponds to the frequency with which management devices in Post Only mode should send camera images. The available settings are: • Send camera images whenever posting to InfraStruXure Central: Images are posted every time InfraStruXure Central communicates with the device. This is the default setting.
Server Administration Tasks Edit Security Entry window opens). This window contains the following controls: Field Description IP range The IP address or IP address range for this security setting. The user name and password will be used only for devices that are connected to your network at the specified IP address or at an IP address that falls within the specified range.
Server Administration Tasks Field Description Port Type in this field the TCPIP port number for which these device timeout settings apply. Timeout Type in this field the amount of time that InfraStruXure Central should wait when attempting to connect to or obtain data from an device in the specified IP address range before declaring it unreachable. Use asterisks as a wildcard value only for whole portions of the IP address.
Server Administration Tasks Network Settings Use the Network Settings pane to configure the InfraStruXure Central server network settings for your server network interfaces. You can configure the following settings: • Hostname • Network interface configuration • Network routing configuration • Domain name server configuration • Internal DHCP LAN To configure the device’s network settings, provide the following information: Field Description Hostname The hostname assigned to the server.
Server Administration Tasks Field Description Enable Internal DHCP LAN check box Check this check box to enable internal DHCP-based LAN support. Important: When enabling the internal DHCP LAN, the private LAN connection must be connected to LAN Port 2 on your InfraStruXure Central appliance. Once this feature is enabled, ensure that LAN Port 2 is NOT connected to a public LAN.
Server Administration Tasks Field Description Requires logon check box Check this check box if the server requires you to log in to send e-mail. User name Provide a User ID that will be accepted by the SMTP server when sending e-mail. Password/Verify password Provide a password that will be accepted by the SMTP server when sending e-mail. All settings except the From address field are available for both a Primary and Secondary e-mail server.
Server Administration Tasks Log Settings Use the Log Management pane to specify the log level filter for use with the InfraStruXure Central server log. The log level value determines what the minimum priority value of a InfraStruXure Central log message must be for that message to be stored in the Server Messages logs. Only messages that are of the selected log level priority or higher will be stored. There are four log level values: DEBUG, INFO, WARNING, and ERROR (in order of increasing priority).
Server Administration Tasks Time Settings Use the Time Configuration pane to specify the date and time that are configured on the InfraStruXure Central server's internal clock, or to configure your server to obtain and synchronize its clock settings from an NTP server. The following controls are available from the Time Configuration pane: Field Description Set Server Time Zone To Select from this drop box the time zone used in the InfraStruXure Central server’s location.
Server Administration Tasks Server Access Use the Server Access pane to enable, disable, and configure settings associated with the different network-accessible processes running on your server. These processes include the web server, the SSH daemon, the SNMP daemon, and the SOCKS proxy. Each of these processes has its own sub-pane in the Server Access pane.
Server Administration Tasks IP ports 1 - 65535 are valid, with the exception of ports 20, 21, 22, 23, 25, 123, 161, and 389. These ports are reserved for use by the NetBotz appliance, and using them would create a conflict and would result in operational difficulties. Note Type in the desired values and then click Apply to save any changes to the server. Click Cancel to close this window without saving any changes.
Server Administration Tasks Server Security Use the Server Security pane to specify the security features of your InfraStruXure Central server. Using this pane, you can change the Server Hardware Password and configure your InfraStruXure Central server to communicate with InfraStruXure Central consoles using a Secure Sockets Layer (SSL) certificate. The Server Security pane consists of two sub-panes: The Server Hardware Password pane and the Secure Sockets Layer (SSL) pane.
Server Administration Tasks To install a certificate, click Install Certificate and then provide the SSL certificate data. • If you have submitted your key to a certification authority and have received your signed certificate, copy and paste the signed certificate into the Install certificate field.
Server Administration Tasks The Storage Settings Pane The Storage Settings pane features a pie chart that shows you the percentage of your storage repositories that is currently being used, as well as the following controls: Field Description Favor remote storage check box When checked, InfraStruXure Central will store data on remote storage repositories unless none are available.
Server Administration Tasks The Repositories Pane The Repositories pane features a list of all currently defined storage repositories. Initially only one entry, Local, will appear in this list. The Local repository corresponds to the on-board hard drive storage that is included with your InfraStruXure Central server. However, you can add additional remote storage repositories using network attached storage (such as an NFS mount or Windows share). To add a remote repository: 1. Click Create. 2.
Server Administration Tasks • If you selected Windows, provide the following information to define the Windows share: Field Description Name (label) A name that will be used to identify this repository in the Storage Repository task interface. Server host name or IP The hostname or IP address of the Windows share. User name The user name required to access the Windows share. Password / Verify password The Password that is required to access the Windows share.
Server Administration Tasks User/Group Administration also enables you to create local user groups. Local user groups are collections of local user accounts. When local user accounts are added, you can simply add the new local user account to a previously defined local user group.
Server Administration Tasks Field Description Full name The full name of the person to whom this user account is assigned. Password/Verify password The password that will be used, along with the user name, to log into the appliance. E-mail address The e-mail address of the user to whom this user account is assigned. Description A description of the local user account. 5. Select the User Roles tab.
Server Administration Tasks Creating and Editing Groups You can use local user groups to quickly and easily organize your local user accounts into groups for simplified user account management. Local user groups can also be created that automatically enable full administrator access to all InfraStruXure Central functionality on all local user accounts that are added to the local user group. To create a user group, or to edit a previously defined user group: 1.
Server Administration Tasks or more previously defined local user accounts from the Choose User(s) pane, and then click OK. 7. Click OK to save your local user group settings. Using Remote Authentication Server Support InfraStruXure Central features support for using LDAP servers in your network to define InfraStruXure Central user accounts. To add a remote LDAP server: 1. Select the Remote Authentication tab and then click Create.
Adding New Devices Use the Add... selection in the Map and Table view context menus to add management devices and SNMP devices to your device groups. Adding a Management Device To add a new management device, select New -> Management device from the Map or Table view context menu.
Adding New Devices Field Description Delete SNMP sensors if not found on crawled device When checked, automatically removes previously defined SNMP-based sensors on a target when, after a successful scan, the sensors are found to no longer be present (no longer defined, unavailable, and so forth). If the sensors are not deleted, they will be displayed with sensor reading values of “N/A” or “null.
Mass Configuration: Sensor and Alert Settings The selections available from the Mass Configuration view enable you perform mass configuration tasks on the NetBotz devices installed on your network.
Mass Configuration: Sensor and Alert Settings Whenever you start a Mass Configuration task, the first window that is displayed shows a table of devices on which the selected task can be performed. This table features a Status column, in which the current status of each device is displayed. If a device is currently in an offline state the Status field for the device will read “Offline,” but you will still be able to enact Mass Configuration tasks on the device, just as if the device were online.
Mass Configuration: Sensor and Alert Settings • Power (Watts) Settings: Use the Power (Watts) Settings to configure thresholds for your device wattage sensors.
Mass Configuration: Sensor and Alert Settings which data files will be stored and the base filename that will be used for FTP data files. For more information on macros supported by BotzWare see “BotzWare Macros” on page 279. • Send E-mail: Sends an alert notification e-mail that contains information about the nature of the alert to one or more e-mail recipients.
Mass Configuration: Sensor and Alert Settings method-specific instructions, see “Creating Alert Actions” on page 221. 5. Click OK to save this new Alert Action for use with all selected devices. Once you have saved the Alert Action it will appear in the list of defined Alert Actions for the selected devices and will be available for use in the Alert Profiles task. Editing Previously Defined Alert Actions To edit a previously defined alert action: 1. Launch the Alert Actions task. 2.
Mass Configuration: Sensor and Alert Settings • Alert Level 2: Begins 20 minutes after an alert condition occurs, repeats 1 time at a 10 minute interval. Initiates the following pre-defined Alert Actions: Secondary E-Mail Notification, HTTP Post, FTP Data Delivery. • Alert Level 3: Begins 90 minutes after an alert condition occurs, repeats 2 times at a 60 minute interval.
Mass Configuration: Sensor and Alert Settings Repeat Until Normal check box is checked. 8. Type in the Interval field (or use the arrow buttons in the field to select) the number of seconds that will pass between repeated notifications in this Alert Sequence. 9. Specify Capture Settings for Graphs and Pictures associated with this Alert Sequence.
Mass Configuration: Sensor and Alert Settings Suppressing Alert Notifications You can also use the Alert Profile task to temporarily suppress all alert notifications associated with an Alert Profile. This temporarily prevents your appliance from generating any alert notifications associated with the selected Alert Profile until a time and date you specify. Once enabled, alert notifications will not be generated -- even if an enabled threshold is violated.
Mass Configuration: Sensor and Alert Settings When you select a report generation method from the Periodic Reports drop box any selected devices (or devices included in a selected device group) that have a defined Periodic Report that corresponds to the selected report generation method are listed. Only devices that have a currently defined Periodic Report entry that corresponds the selected report generation method tab are displayed.
Mass Configuration: Sensor and Alert Settings fields: Field Description Report Name A name for this report. Used to identify the report in the Periodic Reports task window. Interval The frequency with which reports will be generated. InfraStruXure Central server The IP address or hostname of the InfraStruXure Central server to which this report will be sent. Port The IP port on which the InfraStruXure Central server is configured to communicate.
Mass Configuration: Sensor and Alert Settings pane. 2. Double-click on the Periodic Reports icon. 3. Select HTTP Periodic Report the Periodic Reports drop box. Any selected devices with previously created report generation entries of this type are displayed. 4. Click Add, then select one or more NetBotz devices from the device selection list and click Next. 5. A Periodic Report configuration interface window opens.
Mass Configuration: Sensor and Alert Settings This window features Primary and Backup tabs, each of which has the same fields available. The settings specified on the Primary tab are used by default for any periodic HTTP reports. The settings on the Backup pane are used if communication with the Primary server fails. 6. Type the appropriate values in the fields. 7. Specify Advanced Scheduling for the Periodic Report (optional).
Mass Configuration: Sensor and Alert Settings created report generation entries of this type are displayed. 4. Click Add, then select one or more NetBotz devices from the device selection list and click Next. 5. A Periodic Report configuration interface window opens. This window contains the following fields: Field Description Enabled Check this check box to enable periodic FTP reporting.
Mass Configuration: Sensor and Alert Settings Field 124 Description Graph priority Acts as a filter that can be used to limit the amount of sensor data that is graphed and included in the periodic report. You can select High, Medium, or Low priority settings: • High: Only sensor data associated with physical sensors that are integrated with or connected to the appliance will be graphed and included in the report.
Mass Configuration: Sensor and Alert Settings This window features Primary and Backup tabs, each of which has the same fields available. The settings specified on the Primary tab are used by default for any periodic FTP reports. The settings on the Backup pane are used if communication with the Primary server fails. 6. Type the appropriate values in the fields. 7. Specify Advanced Scheduling for the Periodic Report (optional).
Mass Configuration: Sensor and Alert Settings Configuring an E-mail Periodic Report To configure devices to periodically generate and e-mail sensor reports to specified recipients: 1. Select a device group or container from the navigation pane, or select one or more devices from the device list pane. 2. Double-click on the Periodic Reports icon. 3. Select the E-Mail Periodic Report from the Periodic Reports drop box.
Mass Configuration: Sensor and Alert Settings Field Description Graph priority Acts as a filter that can be used to limit the amount of sensor data that is graphed and included in the periodic report. You can select High, Medium, or Low priority settings: • High: Only sensor data associated with physical sensors that are integrated with or connected to the appliance will be graphed and included in the report.
Mass Configuration: Sensor and Alert Settings 6. Type the appropriate values in the fields. 7. Specify Advanced Scheduling for the Periodic Report (optional). By default, all Periodic Reports will be generated according to the Interval value you specify. However, you can specify that a Periodic Report will be active only occur during specific time ranges. To configure Advanced Scheduling: a. Click Advanced Scheduling.... The Advanced Scheduling window opens. b.
Mass Configuration: Sensor and Alert Settings Each sensor threshold configuration task is named either a) for the type of sensor with which the sensor will be used (temperature, air flow, humidity, and so forth) or b) with a general name that describes the sort of sensor that is configured using the task.
Mass Configuration: Sensor and Alert Settings edit the label or history settings and then select Label/History Settings from the context menu. 3. Select one or more NetBotz devices from the device selection list and then click Edit. 4. Type in the Label field a label to identify this sensor. This label can be up to 64 characters in length, and will be used to identify the sensor in alert notifications. 5.
Mass Configuration: Sensor and Alert Settings State Sensors and Thresholds The following Sensor & Alert Settings tasks enable you to configure thresholds on state-based sensors: • Door Settings • Dry Contact Settings • Motion Sensor Setting • Other State Settings The following threshold types can be assigned to any state sensor: • Alert State Threshold: An alert condition occurs if a specified state is reported by the sensor.
Mass Configuration: Sensor and Alert Settings To define a maximum value threshold: 1. Launch the Sensor & Alert Settings task that corresponds to the numeric-based sensor for which you will define a threshold. 2. Select Maximum Value Threshold from the Threshold drop box. Any selected devices that have previously defined maximum value thresholds will be listed in the Management Devices list. 3.
Mass Configuration: Sensor and Alert Settings b.By default, all time periods in the schedule are set to Enabled. To disable the threshold for a currently enabled period of time, highlight the period of time by clicking-and-dragging over the desired time range, and then click Disable. To enable the threshold for a currently disabled period of time, highlight the period of time by clicking-and-dragging over the desired time range, and then click Enable. c.
Mass Configuration: Sensor and Alert Settings To define a minimum value threshold: 1. Launch the Sensor & Alert Settings task that corresponds to the numeric-based sensor for which you will define a threshold. 2. Select Minimum Value Threshold from the Threshold drop box. Any selected devices that have previously defined minimum value thresholds will be listed in the Management Devices list. 3.
Mass Configuration: Sensor and Alert Settings b.By default, all time periods in the schedule are set to Enabled. To disable the threshold for a currently enabled period of time, highlight the period of time by clicking-and-dragging over the desired time range, and then click Disable. To enable the threshold for a currently disabled period of time, highlight the period of time by clicking-and-dragging over the desired time range, and then click Enable. c.
Mass Configuration: Sensor and Alert Settings To define a range threshold: 1. Launch the Sensor & Alert Settings task that corresponds to the numeric-based sensor for which you will define a threshold. 2. Select Range Threshold from the Threshold drop box. Any selected devices that have previously defined range thresholds will be listed in the Management Devices list. 3.
Mass Configuration: Sensor and Alert Settings a. Click Advanced Schedule.... The Schedule Threshold window opens. b.By default, all time periods in the schedule are set to Enabled. To disable the threshold for a currently enabled period of time, highlight the period of time by clicking-and-dragging over the desired time range, and then click Disable.
Mass Configuration: Sensor and Alert Settings Above Value for Time Threshold An above value for time threshold is defined by specifying a maximum acceptable value for selected sensors and a maximum period of time value. If the value reported by the sensor exceeds the specified value for more than the specified period of time an alert condition is reported. To define an above value for time threshold: 1.
Mass Configuration: Sensor and Alert Settings b. Type in the Time Allowed Above Maximum field (or use the arrows in the field to specify) the number of seconds that the reported value can exceed the value specified in the Maximum field before an alert condition is generated. c. Check the Enabled check box to enable the threshold. If this check box is not checked, the alert threshold will be saved but will not be active.
Mass Configuration: Sensor and Alert Settings c. When you have finished creating your Advanced Threshold, click OK to save the schedule and return to the Thresholds task. – Select an Alert Severity value for this threshold. Available Alert Severities are, in order of escalating severity: Information, Warning, Error, Critical, or Failure. By default, the Alert Severity generated by this threshold will be “Error.” – Select Cameras to Trigger in response to the alert.
Mass Configuration: Sensor and Alert Settings list. 3. Select the desired threshold operation and targets: – If you are editing one or more previously defined below value for time thresholds, select the devices on which the threshold has been configured from the Management Devices list and then click Edit. – If you are defining a new below value for time threshold click Add. Then, select one or more devices for which this threshold will be configured, and click Next.
Mass Configuration: Sensor and Alert Settings desired time range, and then click Disable. To enable the threshold for a currently disabled period of time, highlight the period of time by clicking-and-dragging over the desired time range, and then click Enable. c. When you have finished creating your Advanced Threshold, click OK to save the schedule and return to the Thresholds task. – Select an Alert Severity value for this threshold.
Mass Configuration: Sensor and Alert Settings To define a rate of decrease threshold: 1. Launch the Sensor & Alert Settings task that corresponds to the numeric-based sensor for which you will define a threshold. 2. Select Rate of Decrease Threshold from the Threshold drop box. Any selected devices that have previously defined rate of decrease thresholds will be listed in the Management Devices list. 3.
Mass Configuration: Sensor and Alert Settings returned to normal. Default value is 0 (state returns to normal immediately after the measured value is no longer violating the threshold). – Set an Advanced Schedule for this threshold (optional). By default, all thresholds are assumed to be enabled 24 hours a day, 7 days a week. However, you can specify that a threshold will be enabled only during specific time ranges. To set an Advanced Schedule: a. Click Advanced Schedule....
Mass Configuration: Sensor and Alert Settings Rate of Increase Threshold A rate of increase threshold is defined by specifying a maximum acceptable increase in value for selected sensors and a period of time value. If the value reported by the sensor rises by more than the specified maximum acceptable increase in less than the specified period of time an alert condition is reported. To define a rate of increase threshold: 1.
Mass Configuration: Sensor and Alert Settings than the Maximum Increase value in a period of time that is equal to or less than the Time Period value an alert condition is generated. c. Check the Enabled check box to enable the threshold. If this check box is not checked, the alert threshold will be saved but will not be active. Add to the Threshold-Specific Addresses list the e-mail addresses of any personnel to whom email alert notifications should be sent if this threshold triggers an alert condition.
Mass Configuration: Sensor and Alert Settings Application (with Alert Update) privileges opens the resulting alert entry in the Alerts View and clicks the Mark Alert Resolved button. 7. Click OK to save this threshold. Defining State Thresholds Detailed instructions on how to define each of the available state threshold types follow. Alert State Threshold An alert state threshold is defined by specifying the state which, if reported by selected sensors, will cause an alert condition to be reported.
Mass Configuration: Sensor and Alert Settings a. Select from the Alert State drop box the state that, if reported by the sensors, will result in an alert condition. b. Check the Enabled check box to enable the threshold. If this check box is not checked, the alert threshold will be saved but will not be active. Add to the Threshold-Specific Addresses list the e-mail addresses of any personnel to whom email alert notifications should be sent if this threshold triggers an alert condition. Click Add...
Mass Configuration: Sensor and Alert Settings Application (with Alert Update) privileges opens the resulting alert entry in the Alerts View and clicks the Mark Alert Resolved button. 7. Click OK to save this threshold. Alert State for Time Threshold An alert state for time threshold is defined by specifying both a maximum time permitted value and the state which, if reported by selected sensors, will cause an alert condition to be reported.
Mass Configuration: Sensor and Alert Settings a. Select from the Alert State drop box the state that, if reported by the sensors, will result in an alert condition. b. Type in the Time Allowed in Alert State field (or use the arrows in the field to specify) the number of seconds that the reported value can be in the selected Alert State before an alert condition is generated. c. Check the Enabled check box to enable the threshold.
Mass Configuration: Sensor and Alert Settings c. When you have finished creating your Advanced Threshold, click OK to save the schedule and return to the Thresholds task. – Select an Alert Severity value for this threshold. Available Alert Severities are, in order of escalating severity: Information, Warning, Error, Critical, or Failure. By default, the Alert Severity generated by this threshold will be “Error.” – Select Cameras to Trigger in response to the alert.
Mass Configuration: Sensor and Alert Settings previously defined state mismatch thresholds will be listed in the Management Devices list. 3. Select the desired threshold operation and targets: – If you are editing one or more previously defined state mismatch thresholds, select the devices on which the threshold has been configured from the Management Devices list and then click Edit. – If you are defining a new state mismatch threshold click Add.
Mass Configuration: Sensor and Alert Settings c. When you have finished creating your threshold Enable Schedule, click OK to save the schedule and return to the Thresholds task. – Select an Alert Severity value for this threshold. Available Alert Severities are, in order of escalating severity: Information, Warning, Error, Critical, or Failure. By default, the Alert Severity generated by this threshold will be “Error.” – Select Cameras to Trigger in response to the alert.
Mass Configuration: Sensor and Alert Settings will define a threshold. 2. Select State Mismatch for Time Threshold from the Threshold drop box. Any selected devices that have previously defined state mismatch for time thresholds will be listed in the Management Devices list. 3.
Mass Configuration: Sensor and Alert Settings returned to normal. Default value is 0 (state returns to normal immediately after the measured value is no longer violating the threshold). – Set an Advanced Schedule for this threshold (optional). By default, all thresholds are assumed to be enabled 24 hours a day, 7 days a week. However, you can specify that a threshold will be enabled only during specific time ranges. To set an Advanced Schedule: a. Click Advanced Schedule....
Mass Configuration: Sensor and Alert Settings 156 InfraStruXure Central 4.
Mass Configuration: Device Settings The selections available from the Mass Configuration view enable you perform mass configuration tasks on the APC NetBotz devices installed on your network.
Mass Configuration: Device Settings To view detailed information about any of the devices in the device selection list, select a device from the list and then click View. A new window appears that displays additional, highly detailed information about the device, as well as about any pods that are connected to the device (if applicable). The About Information task can be run only on one device at a time.
Mass Configuration: Device Settings Backup Use the Backup task to save your device configurations to password-protected, encrypted files. This backup file, which is stored on the InfraStruXure Central device, contains the entire device configuration, including user accounts settings, pod configurations, alert actions and profiles. Once a device configuration is saved, you can use the Restore task (see “Restore” on page 211) to restore the device configuration at a later date. To use the Backup task: 1.
Mass Configuration: Device Settings • Post-alert Capture Time: Each devices current post-alert capture time setting. The post-alert capture time setting specifies the total number of seconds after the alert triggering event for which images will be included in alert notifications. Select a device from the Camera Configuration device selection window and then click Edit to open the Camera Capture Settings window. Use the Camera Capture Settings window to configure various camera and image capture settings.
Mass Configuration: Device Settings Control Description Color Balance / Type of Lighting / Red Balance / Blue Balance Use this control to specify the color balance settings that will be used by the camera. The four pre-configured Color Balance selections are: • Fluorescent: Best color balance settings for locations with fluorescent lighting. • Incandescent: Best color balance settings for locations with incandescent lighting. • Daylight: Best color balance settings for locations with natural lighting.
Mass Configuration: Device Settings Control Description Post-alert capture time Specifies the total number of seconds after the alert triggering event for which images will be included in alert notifications. The number of post-alert images that are captured is equal to the Post-Alert Capture Time multiplied by the Rate value. Note that the individual Alert Actions may specify a Maximum Camera Pictures setting that is less than the total number of images captured in response to an alert.
Mass Configuration: Device Settings Camera Masking Use the Camera Masking task to specify the conditions that will cause the camera motion sensor of selected devices to generate an alert, to specify a motion sensitivity mask (to ignore motion is userspecified areas of the image) for selected devices, or to specify a block-out mask (to prevent userspecified regions of the image from being seen.
Mass Configuration: Device Settings Field Description Show outline of detected motion check box When this option is enabled, any region of an image captured by the device that is determined to be indicative of motion is surrounded by a dotted-line outline. Note that if this option is enabled then the dotted-line outline will appear in the camera image that is displayed in the Sensor Pane as well.
Mass Configuration: Device Settings Clock Use the Clock task to view or change the date and time that are configured on the internal clock of selected devices, or to configure selected devices to obtain and synchronize clock and calendar settings from an NTP server. To use the Clock task: 1. Launch the Clock task.
Mass Configuration: Device Settings 3. The Clock Settings window opens. The following controls are available from the Clock task: Field Description Enable NTP check box Check this check box to enable the NTP functionality. Un-check this check box to enable the clock and calendar controls on this pane. Primary, Secondary, and Tertiary NTP servers IP address of NTP servers for use in automatically setting the device clock.
Mass Configuration: Device Settings Note There is a limited amount of audio clip storage available on your APC NetBotz 500 device. APC NetBotz 500 devices have a total of 4MB of space available for custom audio clips (shared with any background images that have been stored on the device. For more information, see “Creating and Editing Maps” on page 51). Be sure to take these limitations into consideration when choosing background image files.
Mass Configuration: Device Settings Device Crawlers monitors the following MIB II SNMP values on all specified SNMP targets: • Online: State sensor that reports whether the target is Online or Offline. • Ping RTT: Analog sensor that reports amount of time it takes SNMP queries or ICMP Ping requests to complete a send and reply from the device. • SNMP System Contact: Displays the target’s system contact data (does not support configuration of thresholds).
Mass Configuration: Device Settings • Outgoing Non-Unicast Packets: Analog sensor that reports the number of non-unicast packets sent by the interface. • Outgoing Octets: Analog sensor that reports the number of outgoing octets sent by the interface. • Outgoing Unicast Packets: Analog sensor that reports the number of outgoing unicast packets sent by the interface.
Mass Configuration: Device Settings defined for each device. 2. To continue, select one device from the device selection window and click Edit. 3. The Device Crawlers Settings window opens. This window consists of three panes: – The SNMP Targets pane: Enables you to add, edit, or remove SNMP targets for use with Device Crawlers.
Mass Configuration: Device Settings 5. The following SNMP Target Settings are available: Field Description Hostname/IP address Type in this field the hostname or IP address of the SNMP target. Port Type in this field the port number used for SNMP communications on the target. The default value is 161.
Mass Configuration: Device Settings Field Description Send offline alert if SNMP agent becomes unavailable Check this check box if the monitored device has an SNMP agent and you want Device Crawlers to generate an alert if the device's SNMP agent on this target is unavailable.
Mass Configuration: Device Settings Field Description Maximum Route Hops Use this control to specify the maximum number of hops that will be recorded and saved by Device Crawlers route tracing support. Include Route Trace in Alerts check Check this check box to enable Device Crawlers route tracing box support. If this check box is not checked, route tracing is disabled and alert notifications will not include route tracing data.
Mass Configuration: Device Settings select it. 3. Click Next. A list of available Device Definition Files (including version numbers) appears. Select one or more DDFs that you want to install and use with Advanced Device Crawlers and then click Next. 4. A list of the DDFs you have selected appears. Click Next to download and install the selected DDFs.
Mass Configuration: Device Settings Device Scanner Device Scanner provides highly sophisticated, in-depth monitoring of your supported SNMP physical layer devices. Like the Device Crawlers, Device Scanner enables you to configure your devices devices to monitor the general status information of SNMP targets.
Mass Configuration: Device Settings – The Supplemental OIDs pane: Enables you to configure Device Scanner to monitor the SNMP value of any OID on an SNMP target. 4. Select the SNMP Targets pane, and then click Add (or select a previously defined SNMP target and click Edit). The Add SNMP Target window opens. The following SNMP Target Settings are available: Field 176 Description Hostname/IP address Type in this field the hostname or IP address of the SNMP target.
Mass Configuration: Device Settings Field Description Delete SNMP sensors if not found on crawled device When checked, automatically removes previously defined SNMP-based sensors on a target when, after a successful scan, the sensors are found to no longer be present (no longer defined, unavailable, and so forth). If the sensors are not deleted, they will be displayed with sensor reading values of “N/A” or “null.
Mass Configuration: Device Settings Field Description Maximum Route Hops Use this control to specify the maximum number of hops that will be recorded and saved by Device Scanner route tracing support. Include Route Trace in Alerts check Check this check box to enable Device Scanner route tracing box support. If this check box is not checked, route tracing is disabled and alert notifications will not include route tracing data.
Mass Configuration: Device Settings select it. 3. Click Next. A list of available Device Definition Files (including version numbers) appears. Select one or more DDFs that you want to install and use with Device Scanner and then click Next. 4. A list of the DDFs you have selected appears. Click Next to download and install the selected DDFs.
Mass Configuration: Device Settings To add a supplemental OID: 1. Click Add. The Add Supplemental OID window opens. 2. Select from the Sensor type drop box the type of sensor (temperature, humidity, air flow, and so on) that best matches the data that will be reported by the supplemental OID. 3. Select form the Unit of measure drop box the appropriate unit or measurement (degrees, seconds, volts, and so on) that will be used when reporting sensor data from the supplemental OID. 4.
Mass Configuration: Device Settings Field Description Tertiary DNS server The IP address of the tertiary domain name server. 4. Type the new DNS settings in the appropriate fields. When you are finished, click OK to save any these settings to the selected devices. Click Cancel to close this window without saving any changes.
Mass Configuration: Device Settings tab includes the following fields: Field Description From address The e-mail address that will appear in the “From” field of any email generated by the InfraStruXure Central server. SMTP server The IP address of the SMTP server used to send E-mail. Port The IP port on the e-mail server used for SMTP communications.
Mass Configuration: Device Settings External Ports Use the External Ports task to specify the type of external sensors that are attached to each of the external sensor ports that are integrated with your Sensor Pod 120s and NetBotz devices, and to provide a unique identification label for each external sensor. You can use this task to define custom dry contact sensors. The External Ports task can be run only on one device at a time. Note To use the External Ports task: 1. Launch the External Ports task.
Mass Configuration: Device Settings 5.0V), or 4-20mA) and click OK. 2. You can create the following custom dry contact or analog sensor types: – 0-3.3V analog sensor – 0-5.0V analog sensor – dry contact sensor – 4-20mA sensor Defining a Custom 0-3.3V or 0-5.0V Analog Sensor Once a custom analog sensor is added, it cannot be edited. Custom sensors can only be added or removed. You can view the custom sensor settings for selected sensors by clicking View. Note After you select Analog (0-3.
Mass Configuration: Device Settings Field Description Units The unit of measurement that is used for this sensor. Type in the appropriate values for the analog sensor hardware. When you have finished, click OK to add this sensor definition to the list of available Sensor Types. Defining a Custom Dry Contact Sensor Once a custom dry contact sensor is added, it cannot be edited. Custom dry contact sensors can only be added or removed.
Mass Configuration: Device Settings Defining a Custom 4-20mA Sensor Once a custom 4-20mA sensor is added, it cannot be edited. Custom 4-20mA sensors can only be added or removed. You can view the custom sensor settings for selected sensors by clicking View. Note After you select 4-20mA and click OK, the Add Custom 4-20mA Sensor window opens. This window features the following fields and controls: Field Description Sensor type label The label represents the name of the custom sensor definition.
Mass Configuration: Device Settings External Storage Use the External Storage task to configure your device to store data on the optional Extended Storage System (sold separately, for use only with NetBotz 500 devices) or a network attached storage device (a Windows share or an NFS mount). A maximum of 5000 objects (such as alerts and picture clips) can be stored using External Storage. Sensor readings do not count against the maximum number of object stored.
Mass Configuration: Device Settings Keys task to activate the External Storage task, using the license key you received when you purchased the Extended Storage System and the USB drive has been connected to the device. – Windows Share: Configures the device to use a Windows file system share on a NAS as extended storage. – NFS Mount: Configures the device to use an NFS Mount on a NAS as extended storage. 5.
Mass Configuration: Device Settings To configure your device you use network attached storage for extended storage purposes: 1. Select Windows Share from the Select Storage Type pane and then click Next. 2. The Windows Share Settings pane appears. This pane features the following fields and controls: Field Description Remote hostname/IP The hostname or IP address of the Windows share. Remote share name The name of the Windows share.
Mass Configuration: Device Settings Field Description Subdirectory (optional) The subdirectory in the NFS mount that will be used to store data. If no subdirectory is specified, data will be stored in the root directory of the mount. Authenticate using UID check Check this check box to authenticate all device access to the mount using UID. If checked, be sure to specify the box correct UID value as well.
Mass Configuration: Device Settings Status, which reports whether an IP filter is currently enabled for use on this device. 2. To continue, select a device from the device selection window and click Edit. 3. The IP Filter Configuration window opens. 4. To specify IP Filter criteria, click Add and then specify an IP that will be permitted access. You can also use wildcards to specify a range of addresses. For example, providing an address of 192.168.1.
Mass Configuration: Device Settings the device. 2. To continue, select a device from the device selection window and click Edit. 3. The IPMI Device Configuration window opens. 4. To add a new IPMI device, click Add. To edit a previously created target, select the device from the IPMI Devices selection list and then click Edit. 5. The Add (or Edit) IPMI Devices window opens.
Mass Configuration: Device Settings 6. Type the appropriate values in the fields, and then click OK to save the settings for this IPMIenabled device. To remove previously created IPMI devices from the IPMI Devices selection list, select one (or more) IPMI-enabled devices from the list and then click Remove. License Keys Use the License Keys task to activate or deactivate license key-enabled applications that are available for use on this device.
Mass Configuration: Device Settings To enable functionality using a license key you have purchased or to edit a previously entered license key, select from the License Keys window the name of the license key-enabled functionality, click Edit..., type the license key into the window that appears, and click OK. To remove a previously entered license key, select from the License Keys window the name of the license key-enabled functionality, click Remove...
Mass Configuration: Device Settings Configuration task: Field Description Pods/Sensors selection tree Use this tree to select the device for which you wish to specify location settings. Location Data: Type A list of location settings that are available for the currently selected device to which you can assign additional information attributes. Location Data: Value The currently assigned location value for each of the location settings available for the selected device.
Mass Configuration: Device Settings The log level values are: • 1 - Emergency • 2 - Alert • 3 - Critical • 4 - Error • 5 - Warning • 6 - Notice • 7 - Information • 8 - Trace We strongly recommend that you use a minimum log level of 6 - Notice. This will ensure that log messages that are associated with alerts are recorded in the log. Device logging capabilities are also broken out into specific components and/or functions. By default, all components log at the level specified by the Global Level setting.
Mass Configuration: Device Settings Field Description Component Log Levels This selection list contains a list of all available components or functions for which logging is available. By default, each component will log at the level specified by the Global Level setting. To specify a component-specific log setting, select the Level drop box/field beside the desired component and then select the desired log level for the component.
Mass Configuration: Device Settings Network Interfaces Use the Network Interfaces task to view or change the network settings for the network interfaces supported by selected devices. By default, NetBotz devices feature a single network interface: the device’s built-in Ethernet interface. If you have installed additional network interfaces (such as adding a wireless adapter) you can use this task to configure them as well. The Network Interfaces task can be run only on one device at a time.
Mass Configuration: Device Settings 4. Select the network interface you want to configure and then click Edit. 5. The Edit Network Interfaces window opens, with settings specific to the selected network interface available for editing. – If you are editing an Ethernet interface the following controls and fields appear in the Edit Network Interface window: Field Description Enable interface Check this check box to enable this network interface.
Mass Configuration: Device Settings Field 200 Description Hostname The host name assigned to the device. If you change the hostname value and are using a DHCP server for IP configuration the device will use the new hostname until the next time it renews its IP address license and will request that the DHCP server use the hostname you entered as the device’s hostname from now on.
Mass Configuration: Device Settings – If you are editing a wireless network interface configuration, the following controls and fields appear in the Edit Network Interface window: Field Description Enable interface Check this check box to enable this network interface. Configure via DHCP radio button Select this radio button to configure the selected network interface to use a DHCP server on the network to obtain its IP address, subnet mask, and gateway server settings.
Mass Configuration: Device Settings Field Description Mode Determines the wireless communication method to use within your wireless network. If your wireless network uses wireless access points (WAPs), select Managed. If your wireless network does not use WAPs, select Ad-Hoc. If you are unsure of whether wireless access points are in use in your network, select Automatic and the adapter will attempt to determine if WAPs are present and self-determine its mode.
Mass Configuration: Device Settings Pod Sharing Use the Pod Sharing task to configure NetBotz 500 devices to host “virtual pods.” Pod Sharing, available for use only with NetBotz 500 devices for which the Premium Software Module has been purchased, enables your NetBotz 500 to connect with and receive data directly from devices integrated with or connected to other NetBotz 320, 420 or 500 devices in your network.
Mass Configuration: Device Settings Configure Remote Device window opens. This window contains the following fields: Field Description Hostname/IP address The hostname or IP address of the remote device that the pod or other device to be hosted is either integrated with or connected to. Port TCP port over which pod sharing communications will occur. Default is 80 for HTTP, and 443 for HTTPS. SSL options Select from this drop-box the SSL options that will be used for pod sharing communications.
Mass Configuration: Device Settings devices that are available for sharing from the remote device appears in the Available Pods selection list. 6. Select a pod or other device from the Available Pods list and then click Share Remote Pod to share the pod with your NetBotz 500. 7. Click OK when you have finished adding shared devices.
Mass Configuration: Device Settings Field Description Schedule: Dial-out enable Check this check box to create a schedule of times at which your device will establish a PPP connection, regardless of whether alerts have been generated or not. Note: By default no scheduled dial-out events are configured.
Mass Configuration: Device Settings Field Description Debug - Send debug messages to syslog When checked, debug messages will be forwarded to the syslog host specified in the Log task. SIM PIN / Confirm SIM PIN For modems that use a SIM (subscriber identification module), specify the PIN that is used to unlock the SIM. Note: A SIM may or may not require a PIN in order to function. For modems that do not have a SIM this field must be blank.
Mass Configuration: Device Settings Field Description Request Immediate Dial-up/Cancel If the device does not currently have an active PPP connection to Dial-up Request a network, you can click Request Immediate Dial-Out to establish a connection. The PPP connection, once initiated, will stay active until you click Cancel Dial-Up Request or the device reboots. To change the PPP dial-out/dial-in settings, use the controls to specify the desired settings.
Mass Configuration: Device Settings Proxy Use the Proxy task to provide the necessary settings to enable devices to utilize an HTTP, Socks V4, or V5 Proxy Server. When configured, your devices will use the proxy server for all e-mail and HTTP Post communications, allowing these communications to cross the firewall. These settings do not apply to communications to the device: only communications from the device. To use the Proxy task: 1. Launch the Proxy task.
Mass Configuration: Device Settings Reboot Use the Reboot task to reboot all selected devices. To use the Reboot task: 1. Launch the Reboot task. 2. To continue, select one or more devices from the device selection window and click Reboot. 3. Click OK to confirm that you want to reboot all selected devices. To close this task without rebooting your devices, click Close.
Mass Configuration: Device Settings To change the Region settings, type the new values in the appropriate fields. When you are finished, click OK to save any changes to the device. Click Cancel to close this window without saving any changes. Changes to the Locale or Time Zone of a device will not take affect until the device is restarted. Use the Reboot task (see “Reboot” on page 210) to restart any devices when you have finished configuring the Region settings if needed.
Mass Configuration: Device Settings You cannot change the root account user name. However, to ensure security, you can use the Root Password task to change the default root account password. To use the Root Password task: 1. Launch the Reboot task. 2. To continue, select one or more devices from the device selection window and click Edit. 3. Type in the Password field the new root password for all selected devices. 4. Type in the Verify password field the same password as you typed in the Password field.
Mass Configuration: Device Settings SMS Use the SMS task to view or change the SMS (Short Messaging Service) settings on selected devices. These settings must be configured correctly for the Send Wireless SMS Message alert action to function properly. • The SMS task can be run only on one device at a time. • This task will be available only if a supported PC Card modem that supports SMS functionality has been installed in the selected device. Note To use the SMS task: 1. Launch the SMS task.
Mass Configuration: Device Settings The following controls and data appear in the Advanced pane: Field Description Send debug messages to syslog When checked, debug messages will be forwarded to the syslog host specified in the Log task (for more information see Log). Use default SMS settings Check this check box to use the default SMS values for your SMS-capable modem.
Mass Configuration: Device Settings which includes controls for setting that are specifically for use with SNMP Version 3. • The Version 1/Version 2 pane contains the following fields: Field Description Enable SNMP agent check box Check this check box to enable the SNMP agent on your device. Read-only community Type in this field the read-only community name for SNMP read requests.
Mass Configuration: Device Settings 4. Type the new values in the appropriate fields. 5. When you are finished, click OK to save any changes to the device. Click Cancel to close this window without saving any changes. SSL Use the SSL task to install an SSL certificate on selected devices. This will enable SSL-encrypted communication with the device. The SSL task can be run only on one device at a time. Note To use the SSL task: 1. Launch the SSL task.
Mass Configuration: Device Settings SSL Certificate pane and then click OK to install the certificate. Note • If you received a Privacy Enhanced Mail (PEM) file from your certification authority, click Import Certificate, select the PEM file, and then click OK to import the contents of the PEM file into the Install SSL Certificate pane. To install the imported file, click OK.
Mass Configuration: Device Settings Privilege Set Description Application Gives user access to only the Navigation, Sensor Data and selected portions of the Advanced View Information/Action panes. User accounts configured with the Application Privilege Set can view the Camera, Graphs, Alerts, and About panes.
Mass Configuration: Device Settings previously created user account, select the account from the Users pane and then click Edit. 4. Type in the Name field a name for this account. 5. Type in the User name field the user name that corresponds to this account. 6. Type in the Password field the password that corresponds to this account. 7. Re-type the password in the Verify password field. 8. Select from the Privilege set drop-box the privilege set that will be assigned to this account. 9.
Mass Configuration: Device Settings 3. The Web Server Configuration window opens. This window contains the following fields: Field Description HTTP port The IP port through which HTTP communications are performed. HTTPS port The IP port through which HTTPS communications are performed. HTTP port/HTTPS port Enable check boxes Check the check box to enable the corresponding web server port. Note IP ports 1 - 65535 are valid, with the exception of ports 20, 21, 22, 23, 25, 123, 161, and 389.
Creating Alert Actions The information that must be provided for an Alert Action depends on which alert notification method you have selected.
Creating Alert Actions Central alert notification method are displayed in the pane. – To edit previously created Alert Actions, select the one or more entries from the Send to InfraStruXure Central pane and then click Edit. – To create a new Send to InfraStruXure Central Alert Action, click Add, select one or more NetBotz devices from the device selection list, and click Next. 3. Type in the Alert Action Name field a name for this Alert Action. 4.
Creating Alert Actions notification method are displayed in the pane. – To edit previously created Alert Actions, select the one or more entries from the Activate Button Output pane and then click Edit. – To create a new Activate Button Output Alert Action, click Add, select one or more NetBotz devices from the device selection list, and click Next. 3. Type in the Alert Action Name field a name for this Alert Action. 4. Specify Advanced Scheduling for the Alert Action (optional).
Creating Alert Actions this alert action. All Button Relay devices that are defined for use with this device appear in this selection list. 7. If you want this alert action to also be carried out when violated thresholds return to a normal state, check the Also Activate on Return-to-Normal check box. 8. Click OK to save this Alert Action.
Creating Alert Actions – To create a new Play Audio Alert Action, click Add, select one or more NetBotz devices from the device selection list, and click Next. 3. Type in the Alert Action Name field a name for this Alert Action. 4. Specify Advanced Scheduling for the Alert Action (optional). By default, all Alert Actions are assumed to be active 24 hours a day, 7 days a week. However, you can specify that an Alert Action will be active only when alert conditions occur during specific time ranges.
Creating Alert Actions device’s maximum volume. 8. Click OK to save this Alert Action. Creating a Play Custom Audio Alert Action If you are creating an Alert Action that will use the Play Custom Audio alert notification method: 1. Launch the Alert Actions task. 2. Select Play Custom Audio from the Alert Actions drop box. Any selected devices that have previously been configured with an alert action that uses the Play Custom Audio alert notification method are displayed in the pane.
Creating Alert Actions previously been configured with an alert action that uses the Send Custom HTTP Get alert notification method are displayed in the pane. – To edit previously created Alert Actions, select the one or more entries from the Send Custom HTTP Get alert pane and then click Edit. – To create a new Send Custom HTTP Get Alert Action, click Add, select one or more NetBotz devices from the device selection list, and click Next. 3.
Creating Alert Actions appropriate information in the following fields: – Type in the Target URL field the custom HTTP GET statement that will be generated by the device. – Type in the Target User ID and Password fields the User ID and Password needed to execute the custom HTTP GET command at the Target URL. – Type the Password again in the Confirm Password field. The Target URL field accepts BotzWare macros. Note 8.
Creating Alert Actions Creating a Send Custom Text File to FTP Server Alert Action If you are creating an Alert Action that will use the Send Custom Text File to FTP Server alert notification method: 1. Launch the Alert Actions task. 2. Select Send Custom Text File to FTP Server from the Alert Actions drop box. Any selected devices that have previously been configured with an alert action that uses the Send Custom Text File to FTP Server alert notification method are displayed in the pane.
Creating Alert Actions b. By default, all time periods in the schedule are set to Enabled. To disable the Alert Action for a currently enabled period of time, highlight the period of time by clicking-and-dragging over the desired time range, and then click Disable. To enable the Alert Action for a currently disabled period of time, highlight the period of time by clicking-and-dragging over the desired time range, and then click Enable. c.
Creating Alert Actions notification method are displayed in the pane. – To edit previously created Alert Actions, select the one or more entries from the Send Data to FTP Server alert pane and then click Edit. – To create a new Send Data to FTP Server Alert Action, click Add, select one or more NetBotz devices from the device selection list, and click Next. 3. Type in the Alert Action Name field a name for this alert action. 4.
Creating Alert Actions will be active only when alert conditions occur during specific time ranges. To configure Advanced Scheduling: a. Click Advanced Scheduling.... The Advanced Scheduling window opens. b. By default, all time periods in the schedule are set to Enabled. To disable the Alert Action for a currently enabled period of time, highlight the period of time by clicking-and-dragging over the desired time range, and then click Disable.
Creating Alert Actions Creating a Send E-mail Alert Action If you are creating an Alert Action that will use the Send E-Mail alert notification method: 1. Launch the Alert Actions task. 2. Select Send E-Mail from the Alert Actions drop box. Any selected devices that have previously been configured with an alert action that uses the Send E-Mail alert notification method are displayed in the pane.
Creating Alert Actions the Include a Graph with the Alert check box. 6. If you want audio captured by the Camera Pod to be included in the data check the Include a Sound Clip with the Alert check box. 7. Specify Advanced Scheduling for the Alert Action (optional). By default, all Alert Actions are assumed to be active 24 hours a day, 7 days a week. However, you can specify that an Alert Action will be active only when alert conditions occur during specific time ranges. To configure Advanced Scheduling: a.
Creating Alert Actions Creating a Send HTTP Post Alert Action If you are creating an Alert Action that will use the Send HTTP Post alert notification method: 1. Launch the Alert Actions task. 2. Select Send HTTP Post from the Alert Actions drop box. Any selected devices that have previously been configured with an alert action that uses the Send HTTP Post alert notification method are displayed in the pane.
Creating Alert Actions check the Include a Graph with the Alert check box. 6. If you want audio captured by the Camera Pod to be included in the data check the Include a Sound Clip with the Alert check box. 7. Specify Advanced Scheduling for the Alert Action (optional). By default, all Alert Actions are assumed to be active 24 hours a day, 7 days a week. However, you can specify that an Alert Action will be active only when alert conditions occur during specific time ranges.
Creating Alert Actions notification method are displayed in the pane. – To edit previously created Alert Actions, select the one or more entries from the Send Short EMail Message alert pane and then click Edit. – To create a new Send Short E-Mail Message Alert Action, click Add, select one or more NetBotz devices from the device selection list, and click Next. 3. Type in the Alert Action Name field a name for this alert action. 4. Specify Advanced Scheduling for the Alert Action (optional).
Creating Alert Actions which SNMP trap notifications will be sent. 6. Add to the E-mail Addresses field the addresses of the recipients to whom the e-mail notification will be sent. Click Add..., type in the e-mail address to which the alert notification will be sent, and then click OK. 7. If desired, check the Include Addresses from Thresholds check box to include threshold-specific email recipients.
Creating Alert Actions method are displayed in the pane. – To edit previously created Alert Actions, select the one or more entries from the Send SNMP v1 Trap alert pane and then click Edit. – To create a new Send SNMP v1 Trap Alert Action, click Add, select one or more NetBotz devices from the device selection list, and click Next. 3. Type in the Alert Action Name field a name for this alert action. 4. Specify Advanced Scheduling for the Alert Action (optional).
Creating Alert Actions Creating a Send SNMP v3 Inform Alert Action If you are creating an Alert Action that will use the Send SNMP v3 Inform alert notification method: 1. Launch the Alert Actions task. 2. Select Send SNMP v3 Inform from the Alert Actions drop box. Any selected devices that have previously been configured with an alert action that uses the Send SNMP v3 Inform alert notification method are displayed in the pane.
Creating Alert Actions which SNMP trap notifications will be sent. 6. Type in the Target Host Address field the Hostname or IP address of the SNMP based management system. 7. On the Basic Tab: a. Type in the Authentication User ID field the user ID that will be used when sending informs to the Target Host Address. b. Type in the Authentication Password field the password that will be used when sending informs to the Target Host Address. c.
Creating Alert Actions which SNMP trap notifications will be sent. 6. Type in the Destination Addresses field the addresses (such as e-mail addresses or telephone numbers of SMS-enabled devices) of the recipients to whom the wireless SMS message alert notification will be sent. 7. Type in the Message field the text that will be used for the body of the short-format e-mail message. The Message field accepts BotzWare macros. Note 9. Set Advanced Alert Action settings, if desired.
Creating Alert Actions – To create a new Set Switch Output State Alert Action, click Add, select one or more NetBotz devices from the device selection list, and click Next. 3. Type in the Alert Action Name field a name for this Alert Action. 4. Specify Advanced Scheduling for the Alert Action (optional). By default, all Alert Actions are assumed to be active 24 hours a day, 7 days a week.
Creating Alert Actions state. 9. Click OK to save this Alert Action. 244 InfraStruXure Central 4.
Using the Map View The InfraStruXure Central Map View presents all devices in the currently selected device group in an easy-to-monitor graphic display. Colors are used to indicate the current state of each devices in the device group, alerts or network outages are easily noted, and the current reading of a selected sensor is displayed for all devices.
Using the Map View The sensor that is currently selected is shown above the Map view, in the center of the Action/ Information pane. If you select one or more devices from the Device Selection pane, the icons for the selected devices are selected in the Map view as well. To access other InfraStruXure Central Map View functions, right-click on the Map view to open the Map View context menu. The following selections are available from this context menu: Context Menu Selection 246 Description New...
Using the Map View Context Menu Selection Description Delete monitored device Deletes all selected monitored devices (such as Sensor Pod 120s or Camera Pod 120s). Note: Deleting a monitored device purges all data associated with the monitored device from the InfraStruXure Central database and also deletes the monitored device from any other device groups in which it exists, including other device groups to which you may not have access.
Using the Map View Context Menu Selection Description Mass Configuration Use this flyout menu to quickly select and start Mass Configuration tasks on the selected devices. Filters Enables you to create, edit, or delete filters. These filters are used to determine which devices are included in the Map and Table View. For more information see “Using Filters” on page 57. Tutorial Select Tutorial to display the InfraStruXure Central tutorial.
Using the Map View By specifying device-specific sensor displays, you can ensure that devices that report sensor data that does not correspond with the selected default sensor type will show meaningful data. For example, if you select “Temperature” as a default sensor display, devices that do not include temperature sensors (such as camera pods, for example) would not typically show a current sensor reading of any sort.
Using the Map View If the sensor value that is reported by a device is less than the value you specify for the sensor in the Low Value field then a semi-transparent block of the Low Color will appear behind the device icon. If the sensor value that is reported by a device is higher than the value you specify for the sensor in the High Value field then a semi-transparent block of the High Color will appear behind the device icon.
Using the Table View The InfraStruXure Central Table view presents all currently selected devices in an easy-to-monitor and read table display. Colors are used to indicate the current state of each device, making alerts or offline devices easy to spot. You can also use Table Preferences to specify the data that is displayed for each device. To use the Table view, select a device group from the Group Navigation pane and then click the Table button.
Using the Table View Context Menu Selection 252 Description Delete Device Deletes all selected devices from the current Map. Note: Deleting a device purges all data associated with the device from the InfraStruXure Central database and also deletes the device from any other device groups in which it exists, including other device groups to which you may not have access. Improper use of this function could result in loss of data and could also impact other InfraStruXure Central users.
Using the Alert View The InfraStruXure Central Alert View enables you to easily view a summary of all alert events that were reported by any selected devices on a user-specified day. Any alert events that were active on the specified date as displayed, as are any alert events that were resolved on the selected date, regardless of when the alert event began. Alert events begin at the time a specified threshold is exceeded and end when the alerting sensor has returned to a “normal” state.
Using the Alert View Alert events that are presently ongoing and have not yet been resolved will be displayed with a red background, regardless of the date that is selected. For example, if you select a date from a week past and an alert event is shown that started on the selected date but which has not yet been resolved, it will appear with a red background. This indicated that this alert event continues to be unresolved, even though the date you are viewing in the Alert view is from a time in the past.
Using the Graph/Report View The InfraStruXure Central Graph/Report view enables you to generate reports, for a user-specified time period, from the data collected from the sensor data collected by one or more devices. The data can be plotted in a graph to simplify data collation and comparison, or it can be can be collated into a single report to simplify data collation, collection, and comparison.
Using the Graph/Report View Relative Date radio button. – If you select Date Range, and use the two calendar controls to specify the date range for the graph. – If you select Relative Date, select the time period prior to the present (Today, Last 24 Hours, Last Week, etc.) for which data will be collected. 4. Select from the View pages by drop box what portion of the total amount of data will be shown in each page of the resulting report or graph. 5.
Using Post Only Mode with InfraStruXure Central APC NetBotz devices support InfraStruXure Central Post Only Mode. When a device is configured to use Post Only mode, the APC NetBotz device initiates all communications. Typically, InfraStruXure Central periodically queries any APC NetBotz device that it has discovered for status and environmental data information (for more information, see “Data Collection/Monitoring Settings” on page 74).
Using Post Only Mode with InfraStruXure Central devices being managed by InfraStruXure Central in general, especially when those devices are in a Post Only mode. • If desired, you devices can post to multiple InfraStruXure Central servers. This is useful if your company uses a disaster recovery site. In this case, a second InfraStruXure Central system would be set up at the disaster recovery site and it would receive posts from Post Only devices on the same schedule as the main system.
Using Post Only Mode with InfraStruXure Central Field Description SSL Options Select from this drop box the selection that corresponds to the SSL communication options that you want to apply to communications between the device and the InfraStruXure Central server.
Using Post Only Mode with InfraStruXure Central For example, a NetBotz 420 has 11MB of memory available for alerts, pictures, and sensor data. The maximum alert size that can be configured is 4 MB, which is equivalent to 80-100 640x480 images. If the Post Only interval was set to 60 minutes and the NetBotz 420 generated four 4MB alerts in that tomfooleries, by the time of the next Post Only pictures from the last two alerts would still be present on the device.
Surveillance View The Surveillance View is a separately available license key-based upgrade designed for use with InfraStruXure Central. Surveillance View enables you to easily collate, index and view a summary of all surveillance event images that have been captured on a specified day or range of days. Surveillance events contain picture data that can be indexed and viewed as movie-like “clips,” enabling you to see the sequence of events that caused the Surveillance event to occur.
Surveillance View • Configure your devices to post images in one of three different circumstances: only when alert conditions exist; only when motion is detected by the camera; or only when motion is detected by the camera when an alert condition exists. • Maintain a browsable record of all Surveillance events for review at a later date.
Surveillance View Enabling Surveillance To enable Surveillance on your InfraStruXure Central server, you must install a Surveillance license key. To install your license key: 1. Log into InfraStruXure Central using a user account that has Administrator privileges. 2. Select from the Tools pull-down menu Server Administration > License Keys to start the License Keys task. 3. Select the InfraStruXure Central License Keys tab. 4.
Surveillance View Field 264 Description Thumbnail reset The number of seconds, after previously detected motion has ceased, that a thumbnail image will continue to indicate that motion was detected. Include audio Check this check box to configure devices that are capable of capturing audio to include audio clips with Surveillance events. Note: This option is available only when configuring Camera Pod 120s and CCTV Adapter Pods.
Surveillance View Field Description SSL options Specify the SSL verification that is required when Surveillancelicensed devices are communicating with the InfraStruXure Central server. • No verification: Require SSL support on the server (do not deliver without it), but accept any certificate provided by the server (i.e. self signed certificates will be allowed).
Surveillance View Field Description Target image capture rate Specifies the target number of images captured by the device per second. Note that, depending on image content, network load, and other factors, the actual number of images captured per send can be fewer than the specified value. Event duration trigger (seconds) The minimum number of seconds that must pass before a Surveillance event will be triggered.
Surveillance View About the Surveillance View The Surveillance View consists of four tabbed panes: • The Live Camera View pane, a panel that displays resizable thumbnail image captures for all Surveillance-licensed devices. If a device is currently posting Surveillance data to the InfraStruXure Central server or has posted Surveillance data within a user-specified period of time (the Motion Detected Time-out value) the border around the thumbnail for that device will change to the Motion Detected Color.
Surveillance View thumbnail images, specify the color that will be used to indicate that motion has been detected in a thumbnail image, and to enable an alert tone when motion is detected. – Check the Sort thumbnails on motion check box to automatically show all thumbnails that are currently reporting a Motion Detected state at the top of the Live Camera view pane. – Use the Thumbnail Icon Size drop-box to select Small (160x120), Medium (240x180), or Large (320x240) thumbnail images.
Surveillance View Using the Clip View Pane The Clip View pane enables you to dynamically define and display Surveillance clips from the Surveillance images stored in your InfraStruXure Central database. Clips can be defined and displayed for a user-specified date range, using the following parameters: • The duration for which motion was detected: Defined by specifying the minimum number of seconds that must pass after motion is no longer detected for a clip to considered complete.
Surveillance View Generating Clips To generate clips, you must first select a clip generation method. Clips can be generated interactively or by using a previously defined Surveillance filter. select the radio button that corresponds to the clip generation method you wish to use. • To generate clips interactively, select the Interactive radio button.
Surveillance View Once clips have been generated using your specifications and parameters, a selectable list of clips is displayed in the Clips sub-pane. In addition, a summary of the clips that were generated using the specified parameters, by device, is displayed on the Summary sub-pane. • For a brief summary of the content of a clip, select the clip from the selection list.
Surveillance View The Surveillance Event Clip Player Selected Surveillance clips are played in the Surveillance Event Clip Player window. This window displays the following data about the selected clip: • The Hostname, IP Address, and Location value of the device that generated the images used to create the clip. • The clip image. • The clip content progress and play indicator bar.
Surveillance View play location. You can also drag this indicator left and right to manually display portions of the clip. • To time at which the clip starts and ends, as well as the time that corresponds to the currently displayed clip image. • The total number of individual Surveillance images included in the clip, as well as the number of the currently displayed image. • The controls used to play the clip.
Surveillance View Filters act as shortcuts, enabling you to perform interactive clip generation tasks without having to go through all of the steps that would be necessary to do so in the Clip View pane. Filters are particularly helpful when you frequently generate clips using the same parameters each time.
Surveillance View end dates that will be used to limit the clips that are generated when this filter is run. You can select any of the following: – All Dates: Clips will be generated using all Surveillance data that is contained in the InfraStruXure Central database. – Date Range: Clips will be generated using all Surveillance data that was gathered in the time range between the specified start date and the specified end date.
Surveillance View Surveillance Settings Suggestions The Surveillance capture mode that you specify for your licensed devices can have a significant impact on your network traffic, device workload, and InfraStruXure Central disk usage. Therefore you should choose a post mode that is appropriate for the location of your devices or that is suitable for your specific Surveillance requirements.
Surveillance View Send Continuous During Alerts: Usage Examples You could use the Send Continuous During Alerts mode if: • You are in a high security environment where you are required to have a complete audit record of all timestamped images (including those with no detectable changes) while sensors, such as the door switch, camera motion sensor, or external dry contacts are triggered.
Surveillance View 278 InfraStruXure Central 4.
BotzWare Macros This appendix defines the various macros supported by BotzWare. Macros are case-sensitive and must be entered exactly as shown. Note Device Macros The following macros are supported for use in the settings for attributes that support Device macros: Macro Definition Example ${SERIAL} The serial number of the NetBotz device. 00_02_D3_00_01_13 ${IP} The dotted-decimal IP address of the NetBotz 192.168.2.23 device. ${HOSTNAME} The hostname of the NetBotz device. testbot.netbotz.
BotzWare Macros Macro 280 Definition Example ${ENCLOSURE} The current enclosure ID (from the location settings) for the NetBotz device. RACK1234 ${SLOT} The slot in the enclosure (from the location settings) for the NetBotz device. A23 ${ENCRELLOC} The relative location within the enclosure (from the location settings) for the NetBotz device. ATUPS ${ROOM} The room (from the location settings) for the NetBotz device.
BotzWare Macros Alert Macros Alert macros are used to access attributes particular to the alert being processed at the time the macros are resolved. The following macros are supported for use in the settings for attributes that support Alert macros: Macro Definition Example ${SENSORLUID} The locally unique ID of the sensor generating the alert. TEMP1 ${SENSORGUID} The globally unique ID of the sensor generating the alert. B000113_TEMP1 ${ALERTTYPE} The type of alert.
BotzWare Macros 282 InfraStruXure Central 4.
Troubleshooting Troubleshooting FTP Data Delivery While FTP is a established and standard protocol, it does permit enough variability in server implementation to place limits on the use of the APC NetBotz FTP Data Delivery system. If you are attempting to configure FTP Data Delivery to an FTP server, or are experiencing problems with FTP Data Delivery, the following procedure may be helpful in determining any configuration problems or FTP server limitations.
Troubleshooting Macro Example String ${SENSORGUID} B00011D_TEMP1 ${ALERTTYPE} HIGHERR ${SENSORTYPE} TEMP ${EVENTID} D300011D56AB9016 ${ENCRELLOC} BOTTOMINTERIOR The other macros that are available for use with FTP Data Delivery (“${LOCATION}”, “${ENCLOSURE}”, “${SLOT}”, “${ROOM}”, “${ROOMROW}”, “${ROOMCOL}”, “${HEIGHT}”, “${BLDG}”, “${FLOOR}”, “${COMPANY}”, “${ADDRESS1}”, “${ADDRESS2}”, “${CITY}”, “${STATE}”, “${COUNTRY}”) are free-form text fields from the Location settings task.
Troubleshooting where is the Directory on Server value (including macros) as defined in your FTP Data Delivery settings and then press Enter. If your directory name includes macros that are device specific and which do not change (such as ${IP}, ${SERIAL}, or ${MODEL}) and you know the appropriate macro value then use that value as part of the CD command. Otherwise, use the example value string provided in the table above.
Troubleshooting If this does not succeed (with a message starting with 2xx), the user account may not have sufficient access to write or create files, the server may not support the filename format, or the server may be full. 12. Complete the session by entering the QUIT command. The result message should start with 2xx, and the client should exit.
Troubleshooting 150 Opening BINARY mode data connection for 21-42-03_01.jpg. 226 Transfer complete. ftp: 7729 bytes sent in 0.01Seconds 515.27Kbytes/sec. ftp> quit 221-You have transferred 8661 bytes in 2 files. 221-Total traffic for this session was 9673 bytes in 2 transfers. 221-Thank you for using the FTP service on hoss.netbotz.com. 221 Goodbye.
Troubleshooting If you are unable to perform one or more of these basic network connectivity tasks, the problem probably is occurring as a result of a faulty network configuration and is not due to a device failure: see Basic Network Troubleshooting, below, for some tips on how to troubleshoot network problems. If, however, you are able to perform these tasks and are still encountering network connectivity issues with your device, contact the support staff for instructions.
Warranty and Service Limited warranty APC warrants the InfraStruXure Central server to be free from defects in materials and workmanship for a period of 2 years (hardware) or 90 days (software) from the date of purchase. Its obligation under this warranty is limited to repairing or replacing, at its own sole option, any such defective products. This warranty does not apply to equipment that has been damaged by accident, negligence, or misapplication or has been altered or modified in any way.
Warranty and Service – Global support searching APC Knowledge Base and using e-support.
Life-Support Policy General policy American Power Conversion (APC) does not recommend the use of any of its products in the following situations: • In life-support applications where failure or malfunction of the APC product can be reasonably expected to cause failure of the life-support device or to affect significantly its safety or effectiveness. • In direct patient care.
Life-Support Policy 292 InfraStruXure Central 4.
PN: 02418D02