
Instruction manual
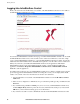
Table Of Contents
- Preface
- Introduction
- About the Installer CD
- Installation and Configuration
- Getting Started
- The InfraStruXure Central Console
- InfraStruXure Central Client Preferences
- InfraStruXure Central Tools Menu
- Server Administration Tasks
- Backup/Restore Administration
- Data Collection/Monitoring Settings
- Device Group Administration
- Discovery Settings
- Disk Array Management
- Export Administration
- Install/Upgrade Management
- License Keys
- Look and Feel
- Management Device Job Control
- Management Device Security Settings
- Management Device Timeout Settings
- Server Settings
- Storage Repositories
- Surveillance Administration
- User/Group Administration
- Adding New Devices
- Mass Configuration: Sensor and Alert Settings
- Configuring Offline Devices
- Managing BotzWare Version 1.x Devices
- About Sensor and Alert Settings Tasks
- Alert Actions
- Alert Profile
- Periodic Reports
- Configuring Sensors and Thresholds
- Mass Configuration: Device Settings
- Configuring Offline Devices
- Managing BotzWare Version 1.x Devices
- About Information
- Monitored Device Settings
- Backup
- Camera Configuration
- Camera Masking
- Clock
- Custom Audio Clips
- Device Crawlers
- Device Scanner
- DNS
- E-mail Server
- External Ports
- External Storage
- IP Filter
- IPMI Devices
- License Keys
- Location
- Log
- Network Interfaces
- Pod Sharing
- PPP/Modem
- Proxy
- Reboot
- Region
- Restore
- Root Password
- Serial Devices
- SMS
- SNMP
- SSL
- Upgrade
- Users
- View Device Logs
- Web Server
- Creating Alert Actions
- Creating a Send to InfraStruXure Central Alert Action
- Creating an Activate Button Output Alert Action
- Creating a Call Web Services Alert Receiver Alert Action
- Creating a Play Audio Alert Action
- Creating a Send Custom HTTP Get Alert Action
- Creating a Send Custom Text File to FTP Server Alert Action
- Creating a Send Data to FTP Server Alert Action
- Creating a Send E-mail Alert Action
- Creating a Send HTTP Post Alert Action
- Creating a Send Short Message E-mail Alert Action
- Creating a Send SNMP v1 Trap Alert Action
- Creating a Send SNMP v3 Inform Alert Action
- Creating a Send Wireless SMS Message Alert Action
- Creating a Set Switch Output State Alert Action
- Using the Map View
- Using the Table View
- Using the Alert View
- Using the Graph/Report View
- Using Post Only Mode with InfraStruXure Central
- Surveillance View
- BotzWare Macros
- Troubleshooting
- Warranty and Service
- Life-Support Policy

Getting Started
32 InfraStruXure Central 4.0 User’s Reference
The Device Selection pane functions as a status monitoring view for the currently selected device group.
If a monitored device in the currently selected device group reports an alert, the device will turn red in the
Device Selection pane. If the device has gone offline it will be “grayed out” and will have a large red X
over its icon. This can be used to simplify troubleshooting and to quickly identify trouble spots.
The Device Selection pane also supports filters. You can use filters to quickly and easily limit the devices
that are displayed in the Device Selection pane. Because the contents of the Device Selection pane
determine what devices are displayed in the various Action/Information pane views (i.e. the Map, Table,
Alert, Graph/Report, Mass Configuration, and Surveillance Views), by filtering the contents of the
Device Selection pane you also filter the contents of all of the other panes as well.
The Action/Information Pane
Located on the right-hand side of the interface, the Action/Information pane contains a series of buttons
that enable you to view information and perform mass configuration tasks on the devices in the currently
selected device group, or the devices that are currently selected in the Device Selection pane. Also, if you
have selected a filter from the Filters drop box in the Device Selection pane then the results will be further
reduced according to the filter settings. Each button, when selected, presents a different view in the
Action/Information pane. The Action/Information pane features 6 buttons:
Pane View Description
Map View Devices are displayed as icons. Current reading reported by a
selected sensor is displayed for each appliance. The default
sensor that is currently selected is shown above the Map View in
the center of the Action/Information pane. Current status can
also be indicated with sensor imaging. If you select one or more
appliances from the Device Selection pane, the icons for the
selected appliances are selected in the Map view as well.
Table View Devices are displayed in a table. Problems, such as appliance
outages or alert conditions are indicated by a user-defined color
(red by default) in the appropriate field. If you select one or
more devices from the Device Selection pane the entries for the
selected appliances in the Table view are selected as well.
Alert View Enables you to easily view all alerts that have been generated by
devices in the currently selected device group. Alerts that
contain picture data can also be viewed, provided that the alert
has been posted to the InfraStruXure Central server using the
device HTTP post support or by using the Send to InfraStruXure
Central or Send HTTP Post alert actions, available using the
Alert Action task. If you select one or more devices from the
Device Selection pane any appliances from the device group to
which the selected devices belong that have reported alerts on
the date selected in the Alerts view will be listed in the Alerts
View. If a device appears in the Alert View but cannot be
selected (and is “grayed out”) then no alerts have been posted to
or collected from the selected appliance on the selected date.