
Developers guide


76
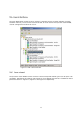
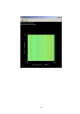
Figure 9-6 Scan status panel
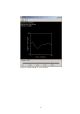
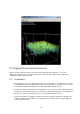
9.6.2 Data visualisation
VisAD was chosen as a graphical package primarily because of its ability to plot image graphs,
as shown in Figure 9-8. The VisAD library is a freely available “Java component library for
interactive and collaborative visualisation and analysis of numerical data” [ 41 ]. Four kinds of
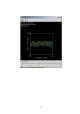
plots were defined for use in the Spectrum Scanner application. These are shown in Figure 9-7
through Figure 9-10.