
Developers guide


80
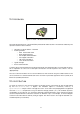
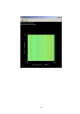
Figure 9-10 3D plot
9.7 Suggestions and enhancements
Version 2.0 of the Spectrum Scanner satisfies all the requirements outlined in 9.3. Since its
deployment, very few issues and bugs have arisen. Most feature requests are for improved
usability and data analysis facilities.
9.7.1 Visualisations
• The VisAD plots are only configured to plot the entire data set, as opposed to a more
manageable subset of this data. Users often want to perform a very large scan and zoom
in to analyse a particular range. This is a very high priority feature to add.
• The signal strength is recorded as an integer from 1 to 16, and this value is plotted linearly
in each plot. For scientific analysis, it is necessary to plot exponentially (2
n
) as opposed to
linearly (n). Dynamic switching of the axes is not a trivial exercise in VisAD.
• Axes on the 3D plot can appear inverted and cause confusion. Rotation of the plot can
make these labels unreadable. This is a limitation of the VisAD toolkit and there appears
to be no solution to this.