
User`s guide

27NetBotz Appliance User’s Guide
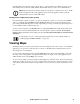
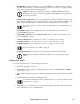
Viewing Graphs
To view a graph of the data collected by a sensor connected to your appliance:
1. Click the Graph View button in the Action/Information pane.
2. Select the pod from the Pods drop-down list that either includes the sensor you need to view or to
which the external sensor that you need to view is connected.
3. From the Sensors drop-down list, select a sensor for which data will be graphed. Only sensors
that are available on the device selected from the Pods drop-down list, and that are included in
the selected sensor set (if applicable) are listed in the Sensors drop-down list.
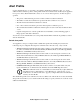
4. Use Start Time and End Time to specify the range of time for which sensor data is graphed, and
use the Refresh Interval drop-down list to specify how often the graph content is updated. The
default Start Time is 60 minutes and the default End Time is Present.
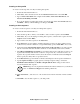
For more information, see “Capture settings” on page 36 (for camera pods and CCTV
adapter pods) or “Settings” on page 61 (for sensor pods).