
User Guide
19
Collecting Data:
The RS-232 output updates to the screen many times per second. Very short-term events can be
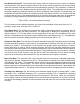
captured simply by disconnecting (there are two telephone symbol icons at the top of the HyperTerminal®
screen for disconnecting and connecting) immediately after the event in question. The scroll bar can be
driven up to the event and all of the data associated with the event can be selected, copied, and pasted
into Microsoft® Excel® or other spreadsheet program as described below.
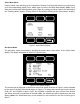
For longer term data, it is useful to capture the data in a text le. With the desired data streaming to the
screen, select “Capture Text” from the Transfer Menu. Type in the path and le name you wish to use.
Push the start button. When the data collection period is complete, simply select “Capture Text” from
the Transfer Menu and select “Stop” from the sub-menu that appears.
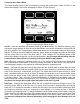
Data that is selected and copied, either directly from HyperTerminal® or from a text le can be pasted
directly into Excel®. When the data is pasted it will all be in the selected column. Select “Text to
Columns...” under the Data menu in Excel® and a Text to Columns Wizard (dialog box) will appear.
Make sure that “Fixed Width” is selected under Original Data Type in the rst dialog box and click “Next”.
In the second dialog box, set the column widths as desired, but the default is usually acceptable. Click
on “Next” again. In the third dialog box, make sure the column data format is set to “General”, and click
“Finish”. This separates the data into columns for manipulation and removes symbols such as the plus
signs from the numbers. Once the data is in this format, it can be graphed or manipulated as desired.
For extended term data capture see: “Sending a Simple Script to HyperTerminal®” on page 20.
Data Format:
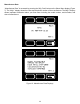
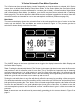
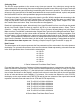
The data stream on the screen represents the ow parameters of the main mode in the units shown on
the display. For volumetric ow meters, there are two columns of data representing volumetric ow rate
in the units specied at time of order and the selected gas.
+4.123 Air
+4.123 Air
+4.123 Air
+4.123 Air
+4.124 Air
+4.125 Air
V Series Volumetric Flow Meter Data Format
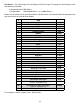
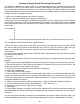
For mass ow meters, there are 5 columns of data representing pressure, temperature, volumetric ow,
mass ow and the selected gas. The rst column is absolute pressure (normally in PSIA), the second
column is temperature (normally in °C), the third column is volumetric ow rate (in the units specied at
time of order and shown on the display), and the fourth column is mass ow (also in the units specied
at time of order and shown on the display). For instance, if the meter was ordered in units of SCFM,
the display on the meter would read 2.004 SCFM and the last two columns of the output below would
represent volumetric ow and mass ow in CFM and SCFM respectively.
+014.70 +025.00 +02.004 +02.004 Air
+014.70 +025.00 +02.004 +02.004 Air
+014.70 +025.00 +02.004 +02.004 Air
+014.70 +025.00 +02.004 +02.004 Air
+014.70 +025.00 +02.004 +02.004 Air
+014.70 +025.00 +02.004 +02.004 Air
M Series Mass Flow Meter Data Format