
User Manual

136 Chapter 6 Creating Charts
Pie Charts
For pie charts, Keynote charts only the first data set in the Chart Data Editor (the first
data point for each data series). If the data series are in rows in the Chart Data Editor,
only the first column is charted; if the data series are in columns in the Chart Data
Editor, only the first row is charted. Thus, one pie chart represents a single data set,
and each wedge is one element in that set. Other data sets in the Chart Data Editor
are maintained, but they are not displayed in the pie chart. You can chart any data set
by moving it to the first position in its row or column.
To select individual pie wedges:
1 Select the chart, and then click to select a single wedge.
2 To select additional wedges, do one of the following:
 To select all the wedges, choose Edit > Select All (or press Command-A).
 To select noncontiguous wedges, hold down the Command key as you select each
wedge.
 To select a continuous range of wedges, select the first wedge, and then hold down
the Shift key as you select the last wedge.
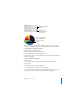
On pie charts, in addition to showing values for wedges, you can display the series
name.
To show a series name in a pie chart:
1 Select the chart or individual pie wedges.
2 In the Chart Inspector, click the Series button.
3 Choose Show Series Name from the Data Point Label pop-up menu (an item is
selected when it has a checkmark next to it).
4 Choose Inside or Outside from the Data Point Label pop-up menu.
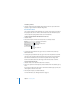
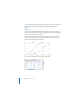
To separate individual pie wedges:
1 Select the individual pie wedges. (To select more than one pie wedge, hold down the
Command key as you click each wedge.)
2 Drag the pie wedges or the Explode slider until the pie wedges are separated as far as
you want.
You can also type a number in the Explode field, or use the arrows to increase or
decrease the number.