
User Manual

140 Chapter 6 Creating Charts
For more information about using the Graphic Inspector to set line color, shadow, and
the fill for data point symbols, see Chapter 4, “Changing Object Properties,” on
page 80.
Scatter Charts
Scatter charts display data differently from the other kinds of charts. They require at
least two columns of data to plot values for a single data series. To show multiple data
series, you use additional two-column pairs.
Each pair of values determines the position of one data point. The first data value in
the row is the X-axis of the point. The second data value is the Y-axis of the point.
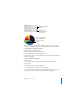
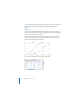
Here’s what the default scatter chart looks like.
You can view the data for this chart in the Chart Data Editor.