
2


100 Chapter 6 Creating Charts
 To select a continuous range of wedges, select the first wedge, then hold down the
Shift key as you select the last wedge.
On pie charts, in addition to showing values for wedges, you can display the series
name.
To show a series name in a pie chart:
1 Select the chart or individual pie wedges.
2 In the Chart Inspector, click the Series button.
3 Select Show Series Name from the Data Point Settings pop-up menu (an item is
selected when it has a checkmark next to it).
4 Choose Inside or Outside from the Data Point Settings pop-up menu.
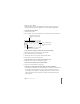
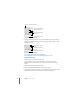
You can separate any (or all) of the pie wedges.
To separate individual pie wedges:
1 Select individual pie wedges. (To select more than one pie wedge, hold down the
Command key as you click each wedge.)
2 In the Chart Inspector, click the Series button.
3 Drag the pie wedges or the Explode slider until the pie wedges are separated as far as
you want.
You can also type a number in the Explode field, or use the arrows to increase or
decrease the number.
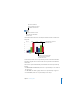
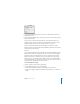
For pie charts, place the data
point values and series name
inside or outside the selected pie
wedge. Display values as
percentages or numbers.
Add shadows to individual
wedges or the whole pie.
Separate individual pie
wedges.