Keynote 3 User’s Guide
K Apple Computer, Inc. © 2006 Apple Computer, Inc. All rights reserved. Under the copyright laws, this manual may not be copied, in whole or in part, without the written consent of Apple. Your rights to the software are governed by the accompanying software license agreement. The Apple logo is a trademark of Apple Computer, Inc., registered in the U.S. and other countries.
Contents 6 6 15 17 17 Preface: Welcome to Keynote Keynote Features at a Glance What’s New in Keynote 3 How to Use Menus Resources for Learning More 19 19 20 21 26 27 28 Chapter 1: Overview of Keynote The Keynote Window The Slide Canvas Different Views The Notes Field Comments Keynote Tools 33 33 35 41 42 44 Chapter 2: Creating a Presentation Step 1: Select a Theme Step 2: Create Your Slides Step 3: Organize Your Slides Step 4: Save Your Slideshow Step 5: Play Your Slideshow 45 45 Chapter 3: Working
77 78 79 Modifying Layouts Changing the Slide Background Retaining or Undoing Your Style Changes 80 80 85 86 Chapter 4: Changing Object Properties Using Color and Image Fills Changing Border Style and Color Positioning Lines 86 88 89 90 92 Adding Shadows Adjusting Opacity Adjusting Images Changing an Object’s Orientation Changing an Object’s Size and Position 93 93 95 98 98 105 106 108 109 110 Chapter 5: Creating Tables Adding a Table Working With Table Cells and Borders Entering and Editing Conte
145 147 152 Creating Object Builds Working With Object Builds Creating Builds on Master Slides 153 153 156 159 Chapter 8: Viewing, Printing, and Exporting Your Slideshow Customizing a Presentation for Your Audience Viewing Full-Screen Presentations Finding Presentations With Keywords 160 163 165 Setting Presentation Options Printing Your Slides Exporting to Other Viewing Formats 172 173 178 180 181 Chapter 9: Designing Your Own Master Slides and Themes Modifying Master Slide Backgrounds and Layouts C
With Keynote, impressive presentations are just the beginning. This preface provides an overview of Keynote features and lists resources for learning more. Keynote is a robust program for creating professional-quality presentations. Powerful, simple tools make it easy for you to deliver compelling presentations, create studioquality storyboards and portfolios, and build interactive slideshows. You can incorporate photos, movies, or music from your iLife libraries, as well as Safari web snapshots.
Professional-Quality Designs Keynote provides a wide variety of themes—including HD themes—you can use to quickly create stunning presentations. Every theme includes coordinated colors, text, charts, and tables. You can easily change a slideshow’s theme at any time, and you can modify themes to suit your needs. You can even set off sections of your slideshow by using multiple themes in the same presentation.
Animated Text and Slide Transitions Bring your text to life with studio-quality text animations. Choose from an array of text and word animations. Animate text so that lines enter the slide one at a time or in groups. Add interest by using two or more text columns on a slide and by using special styles of text and image bullets. Transition between slides with dramatic transition effects such as swoosh, droplet, and reflection.
Powerful Animation Tools Create complex slide animations quickly and easily—any element can be moved and animated. Mix charts, tables, and graphics on the same slide. Fine-tune animations by changing the order in which elements appear and how they enter and exit a slide. Create sophisticated animations (“object builds”) and slide transitions. Synchronize the entry and exit of multiple objects on a slide.
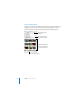
Easy-to-Use Media Tools Find items you’ve stored in your iPhoto or iTunes library, or in your Movies folder, and drag photos or tunes right to a slide. Add images and adjust brightness, contrast, exposure, saturation, hue, sharpness, and light cutoff levels right within Keynote. Choose iPhoto, iTunes, or Movies. Select the album where your picture is located. Drag a thumbnail to the slide or to an image well in one of the inspectors. Search for a file by name.
Free-Form Curves, Shapes, and Masks Create any shape using Bézier curves. Crop images by using masks of different shapes. Choose from predrawn shapes or create your own custom shape to use as a mask. With a mask, you reveal only the part of an image you want to show on a slide, without altering the original file. Create a custom mask to frame part of a photo. Position the mask over the image, and then optionally edit the mask. Here, it’s rotated and resized. The original image is framed by the mask.
Realistic 3D Charts Show off 2D data in 3D-rendered bar, line, and area charts. Choose realistic woodgrain, metal, and other textures. Apply multiple different lighting styles for interesting reflections. Tables with Calculation and Sorting Automate calculation in any cell in a table using arithmetic formulas and values from other cells. Sort by row or column, in ascending, descending, numerical, or alphabetical order. Format numbers with currency formatting and dates with international standards.
Easy-to-Use Inspectors Keynote inspectors makes it easy to format your slides as you work. You use the ten inspectors to format most elements in a slideshow.
Tools for Advanced Presenters Set up a projector display for the audience and your laptop screen as the presenter display, or rehearse your presentation by viewing the show on only one display. While you give your presentation, you can view information such as the current and next slide, elapsed time or time remaining, a clock, and slide notes. Control movie playback during a presentation using keyboard shortcuts. Jump to any slide by typing its slide number.
What’s New in Keynote 3 Keynote 3 provides new features that help you create attractive, compelling slideshows. Â New themes Use Apple-designed themes for presentations, storyboards, and self-running presentations. Apply new HD themes with 16 x 9 aspect and pixel dimensions of 1920 x 1080.
 Image masking with any shape Focus on any part of an image using any shape or custom Bézier curves. Mask images with any shape to remove a background or any other unwanted object. Create your own mask using Bézier curves in any shape.  Enhanced iLife integration Share your presentation with iDVD and iPhoto. Export your presentation into iDVD with chapter breaks between slides and active hyperlinks.
How to Use Menus To complete many of the tasks in this book (and in Keynote Help), you use menu commands. The instructions look like this: m Choose Help > iWork Tour. The first term after Choose is the menu you click; the next term is the item you choose from that menu. Resources for Learning More To get the most out of Keynote, consult the following resources: Tour For an onscreen demonstration of what you can do with Keynote, view the tour. Open the tour by choosing Help > iWork Tour.
Help tags are also available for many onscreen items. To see a help tag, let the pointer rest over an item for a few seconds. Help tags in the Inspector window are useful for learning about the effects of various options. To display a help tag, rest the pointer over an item. Web Resources Go to www.apple.com/keynote to get the latest software updates and information. You can also purchase Keynote products on the web. Technical Support A variety of support options are available to Keynote users.
1 Overview of Keynote 1 This chapter introduces you to the windows and tools you use to create presentations with Keynote. When you create slides in Keynote, you create a Keynote document. The entire slideshow—including all the graphics, media, and chart data—is contained within this one document. This means that you can easily move the presentation from one computer to another.
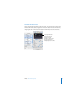
The toolbar: Customize it to include the tools you use most often. The slide organizer: View a visual outline of your slide presentation. You can view a thumbnail of each slide or a text outline. The slide canvas: Create each slide by typing text and adding media. The notes field: Add text about individual slides. You can refer to these notes during your presentation—the audience won’t see them. The Slide Canvas The slide canvas is where you create each slide.
You create a slideshow using a theme—a family of master slides—to ensure a handsome and cohesive look throughout your presentation. Master slides provide predesigned layouts for various kinds of slides, with coordinated fonts, textures, chart properties, and more. Each theme contains a variety of master slides, making it easy to add titles, bulleted text, and graphics. As you work on your slides, you may want to zoom in or out to get a better view of what you are doing.
To hide the slide organizer: m Click the View button and choose Slide Only or Light Table (or choose View > Slide Only). Navigator View In navigator view, the slide organizer displays a thumbnail image of each slide in your presentation, making it easy to see the flow of graphics-rich presentations. To help you organize your presentation as you work, you can group slides by indenting them, creating a “visual outline” of the slideshow.
Working With Slides When you create a new slideshow, Keynote automatically creates a title slide for you. When you add the first slide after that, Keynote automatically switches to a “Title & Bullets” slide layout, unless you choose a different master for the first slide. You can change the master used for that or any other slide by clicking Master in the toolbar and choosing a different layout. If you choose a different master for the first slide, the next slide you insert will use the master you chose.
To display a skipped slide: m Select the slide (it looks like a line in the slide organizer) and choose Slide > Don’t Skip Slide. To delete a slide: m Select the slide in the slide organizer and press the Delete key. If the slide had subordinate slides grouped below it (known as “children”), they are moved up by one outline level. To delete a slide and all the slides grouped below it: m Collapse the group of slides (click the arrow to the left of the top slide) and press the Delete key.
In outline view, you see the text in titles and bullet points. You can add or edit text directly in outline view. As in navigator view, you can skip slides so that they don’t appear when you play your slideshow. Drag bullets to another slide or drag them to create a new slide. Drag bullets left or right to move them to a higher or lower outline level. Double-click a slide icon to hide its bulleted text in the slide organizer.
To move a bullet to a higher outline level on the same slide: m Click anywhere in the text and press Shift-Tab, or drag the bullet to the left until a blue triangle appears. To move bullets to another slide: m Drag the selected bullets out of the current slide to a different slide. To move bullets from one slide and create a new slide: m Drag the bullets to the left of the other bullets on the slide until a blue triangle appears above the slide.
Comments Comments provide an easy way to save your ideas and place them on slides as reminders. You can move comments anywhere on the slide canvas. Your comments appear on the display while you’re editing, and they appear on the presenter display, but they don’t appear to your viewers when you play the presentation. If you use comments frequently, you may want to add the Comments button to the toolbar. To do so, choose View > Customize Toolbar and drag the Comments button to the toolbar.
To close a comment: m Click the x in the upper-right corner. To change text styles and background colors: Â Text: See “Editing Text and Text Properties” on page 45 for details on changing text style and format. Â Color and fill: See “Using Color and Image Fills” on page 80 for details on changing the background color in comments. To print with comments showing: 1 Make sure the comments appear on the slide canvas, as described earlier. 2 Print the document.
Add a free text box, shape, table, chart, or comment. Open the Inspector window and Media Browser. Click these buttons to add or delete slides or to play the slideshow. Click to choose a new view, theme, or master slide. Adjust images. Turn a group of objects into one object (or one into its components); move an object on top of or underneath other objects. Open the Colors window; click the arrow to open the Fonts window.
Click one of these buttons to display a different inspector. To open the Inspector window: m Click Inspector in the toolbar (or choose View > Show Inspector). Click one of the buttons at the top to display an inspector. Clicking the second button from the left, for example, displays the Slide Inspector. You can have several Inspector windows open at the same time. To open more than one Inspector window at the same time: m Choose View > New Inspector.
To search for a media file: m Type the title or filename in the search field at the bottom of the Media Browser window. If you’ve added a title to an image, Keynote won’t find the image. Keynote searches on whatever name is visible in the Media Browser. For details about the Media Browser, see “Using the Media Browser” on page 68. The Colors Window You use the Mac OS X Colors window to choose colors for text, shapes, or shadows.
To open a shortcut menu: m Hold down the Control key while you click an object.
2 Creating a Presentation 2 This chapter outlines the basic tasks and steps for completing a professional-quality slide presentation. Importing a PowerPoint or AppleWorks Presentation If you already have a slide presentation that you created in Microsoft PowerPoint or AppleWorks, you can import it into Keynote and continue to work on it. Simply drag the PowerPoint or AppleWorks document icon to the Keynote application icon.
2 Choose a slide size from the Slide Size pop-up menu. For highest quality playback, your slide size should match the screen resolution of the display on which the slideshow will appear. Keynote offers an HD resolution of 1920 x 1080 (not all themes offer this resolution). Most projectors work best with slides set at the 1024 x 768 size; newer projectors can display slides at a higher resolution. All Keynote themes come optimized for 800 x 600 and 1024 x 768 sizes.
To modify themes or create your own, see Chapter 9, “Designing Your Own Master Slides and Themes.” You can use more than one theme in a presentation; see “Using Multiple Themes” on page 42. Kinds of Slideshows You can make three different kinds of presentations in Keynote, depending on how the presentation will be used. It’s a good idea to keep the kind of presentation in mind as you design it. Note that hyperlinks are available in a normal presentation, not just in a hyperlinks-only presentation.
Each Keynote theme includes a family of master slides. Each master slide has a different layout that may include title and body placeholder text, as well as object placeholders for graphics, tables, and charts.
Adding Text Master slides provide placeholder text (which you replace with your text) for slide titles and body text. Choose a master slide with the combination of title text and body text that best suits the slide’s content. Title text is larger than body text. Most body text is bulleted (preceded by a “dot” or other ornament), but you can change from bulleted to non-bulleted text. To learn more about text formatting, see See “Using the Text Inspector” on page 46.
Double-click in a title text box and type a title. The font and text size are already set for you. Double-click in a body text box and type to create text. The style, font, and text size are already set. Drag a graphics file from the Media Browser or Finder to your slide. You can change the look of the text and bullets in any of your slides using the Text Inspector and the Graphic Inspector.
 Drag a graphics file from the Finder to the slide canvas.  Choose Insert > Choose, select the graphics file, and click Insert.  To create a new slide with the graphic on it, drag the graphics file from the Finder to the slide organizer. You can modify a graphic’s colors, alignment, orientation, and other properties by using the inspectors. Images can be adjusted with the Adjust Image window. You set object placement, size, and orientation in the Metrics Inspector.
To change the unit of measure in the rulers: 1 Choose Keynote > Preferences and click Rulers. 2 Choose an item from the Ruler Units pop-up menu. Make sure that “Display ruler units as percentage” is deselected. Selecting this option displays measurements as a percentage of the distance across the slide, rather than in the chosen unit of measure. To place the ruler’s horizontal origin point at the left edge of the slide: m In the Rulers pane of Keynote preferences, deselect “Place origin at center of ruler.
If alignment guides are getting in the way as you work, you can temporarily hide them. To temporarily hide pop-up alignment guides: m Hold down the Command key while dragging an object. You can turn off pop-up alignment guides and size and position tags in the Rulers pane of Keynote preferences. You can make alignment guides appear only when object edges are aligned, or only when object centers are aligned.
For more information about indenting and organizing slides, see “Different Views” on page 21. Using Multiple Themes As your presentation takes shape, you may want to use different themes for different slides within the same presentation. For example, you could have one look for slides about past business performance and another for sales projections. To use multiple themes in a document: 1 In the slide organizer, select the slide or slides you want to have a different theme.
To save a Keynote file: 1 Choose File > Save. 2 Type a name for the slideshow and choose where you want to store it. 3 Click Save. Keynote provides advanced saving options for special circumstances. To see these options, click the disclosure triangle (to the right of the filename) in the Save dialog. Â When you add sound or movies to your slideshow, Keynote automatically saves them with the file. This is helpful if you plan to transfer the slideshow to another computer.
Step 5: Play Your Slideshow You can show your finished presentation on your computer’s display or project it onto a screen for a larger audience. To play the presentation on your computer: 1 In the Finder, double-click the Keynote document icon. 2 Click Play in the toolbar (or choose View > Play Slideshow). Note: Clicking Play plays the slideshow starting with the currently selected slide.
3 Working With Text, Graphics, and Other Media 3 By incorporating text, graphics, sound, and movies, you can create compelling presentations with Keynote. It’s easy to add and modify text and the other elements you use in a presentation. This chapter describes in detail how to add various media to your presentations. Editing Text and Text Properties To add text to a text box or shape, simply click to select the text box or shape and start typing.
3 When you’ve finished typing, click outside the text box. Or, to stop editing text and select the text box, press Command-Return. 4 Drag the handles on the text box to change its width. Free text boxes automatically grow or shrink vertically to accommodate the length of your text. You cannot make them taller by dragging. To make a free text box taller without expanding its contents, drag the selection handles to make the box narrower (that is, force the box to grow vertically).
The Text Inspector button Click the color well to change the color of selected text. Use these buttons to align text. Drag the sliders to adjust character, line, and paragraph spacing for selected text. Change the space between text and the text box, table cell, or shape that contains it. To open the Text Inspector: m Click Inspector in the toolbar (or choose View > Show Inspector, and then click the Text Inspector button).
Use the vertical alignment buttons to align text at the top, center, or bottom of the text box. Use the horizontal alignment buttons to align text on the left, center, right, or both left and right (justified). To adjust the spacing between lines of text within a paragraph or bullet: 1 Select the text you want to change (or select a text box). 2 In the Text Inspector, drag the Line slider to adjust the line spacing.
 Multiple: Sets line spacing values between single and double, or greater than double.  At Least: The distance between lines is never less than the value you specify and may be more, to prevent larger fonts from overlapping. Use this setting when the distance between lines should remain fixed, but you don’t want overlap if the text becomes large.  Between: Increases the space between the lines, instead of increasing the height of the lines. In contrast, double-spacing doubles the height of each line.
To change a tab to a different type: m Control-click the tab icon and choose a tab type from the shortcut menu. Or doubleclick the tab icon in the ruler repeatedly until the type of tab you want appears. Choose from among these tab types. To insert a tab in bulleted text or table text: m Press Option-Tab.
Changing the Inset Margin You can change the amount of space between text and its container (a text box, shape, or table cell). This measurement is called the “inset margin.” The amount you specify is applied equally around the text on all four sides. Specify how much space there is around text. Note: You can’t adjust the inset margin for bulleted text. To adjust the amount of space around text: 1 Select the text.
3 Choose an option from the pop-up menu. For some options, you can adjust the size and vertical alignment using the fields on the right. Â No Bullets: Use this option to create plain text without bullets. Â Text Bullets: Choose an option from the pop-up menu or type the character(s) you want to use in the text box. You can use any keyboard character. To change a text bullet’s color, click the color well and choose a color in the Colors window. Â Image Bullets: Choose from one of the images provided.
2 Click Columns in the Text Inspector. 3 In the Columns field, type the number of columns you want, or click the arrows. Type the number of columns you want, or click the arrows. Column measurements appear here. Text you type in the first column flows into the second column when the first column is full. To set up different column widths: 1 Deselect the “Equal column width” checkbox. 2 To change width, double-click a column value in the column measurements list and type a new value.
Adding Shapes You can draw shapes—such as lines, rectangles, rounded rectangles, ellipses, triangles, and arrows—directly in Keynote. You can draw custom shapes with curves you adjust. Working with the shapes you create is the same as working with predrawn shapes. Your shapes can contain text. They can be resized and repositioned and can have the line style, color, shadow, opacity, and orientation you choose.
Draw tool icon The pointer changes from an arrow to a small pen tip. 2 Click the cursor anywhere in the slide to create the first point of the custom shape. 3 To create a second point and connect it with the first point using a straight line, click a second location. To create a curved segment instead of a straight one, click the second location and drag the mouse to change the curve angle or extend the curve. Release the mouse when you’re satisfied with the curve.
3 To add additional points, click other locations as needed. 4 To stop drawing and close the shape, click the point at the end of the open segment. Editing Predrawn and Custom Shapes You can change the contour of predrawn and custom shapes by manipulating the points in the shape. To make a predrawn shape editable: m Select the shape, and then choose Format > Shape > Make Editable. To make a custom shape editable: m Click once in the shape to select it, and then click a second time to show its points.
3 Move the point as needed. To reshape a curve: 1 Make the shape editable. 2 Click a point on the curve you want to reshape. A control handle appears on both sides of the point. Drag a control handle or rotate one or both control handles to change the curve. You can also drag a point to modify the curve. 3 To expand or contract the curve, drag the point or one of the control handles. 4 To change the angle of the curve, move the control handles clockwise or counterclockwise.
 To change all corner points in one or more shapes into curved points, select the shape(s) and choose Format > Shape > Smooth Path.  To change all curved points in one or more shapes into corner points, select the shape(s) and choose Format > Shape > Sharpen Path. Editing Specific Predrawn Shapes Some predrawn shapes have special built-in editing controls that you can use in addition to those described above.
To edit a star: m When you select a star shape, a slider appears. Drag the slider to increase or decrease the number of points in the star. Drag to change the angles between points in the star. View the number of points currently in the star. Drag to increase or decrease the number of points in the star. To edit a polygon: m When you select a polygon, a slider appears. Drag the slider to increase or decrease the number of sides in the polygon. View the number of sides currently in the polygon.
The “+” means the shape contains more text than can be seen. To display the rest of the text, resize the object. Changing Line and Fill Colors You can change the line colors and fill colors of drawn objects. For more information, see Chapter 4, “Changing Object Properties.” Adding Pictures From iPhoto You can drag images directly from the Media Browser (or your iPhoto library) to a slide. To add an image from the Media Browser: 1 Click the Media button in the toolbar (or choose View > Show Media Browser).
Using PDF Files as Graphics If you intend to greatly enlarge or reduce a graphic’s dimensions, consider converting it to a PDF file before bringing it into Keynote. PDF files don’t lose their crispness when they are significantly resized. Other file types may not retain their clarity as well when they are enlarged or reduced. PDF files also provide a great way to move tabular data from Excel or AppleWorks documents into Keynote.
Resizing, Moving, and Layering Objects After you move text and graphics to the slide canvas, the text and graphics objects work much the same way. They can be moved in front or in back of one another and formatted or manipulated in similar ways. You work with grouped objects the same way you do with single objects. For more information, see “Grouping and Locking Objects” on page 65. To move an object: m Click the object to select it (make the selection handles appear), and then drag it.
To rotate an object: 1 Select the object. 2 Hold down the Command key and move the pointer toward a selection handle until it changes to a curved, double-headed arrow. 3 Drag the selection handle to rotate the object. Or, use the Rotate wheel or Angle field in the Metrics Inspector. Masking (Cropping) Images You can crop images without actually changing the image files by masking parts of them. The mask contains a window that defines the boundaries of the cropped image.
 To rotate the window, hold down the Command key as you drag the selection handles. Drag the selection handles to resize the visible portion of the image. 4 Double-click the window to make only the masked area visible. The masked image has a dotted line around its visible borders. 5 Drag the selection handles to resize or Command-drag to rotate the visible portion of the image, or drag the entire image to reposition it on the page.
Note: If you often mask objects, you can add the Mask button to the toolbar by choosing View > Customize Toolbar. The Mask button switches to Unmask when you select a masked image. To unmask an image (so that the whole image reappears): m Select the image and choose Format > Unmask. To crop an image using a predrawn or custom shape as a mask: 1 Insert the image you want to mask. 2 Add a shape to the slide to use for the mask. 3 Select both the image and the shape. 4 Choose Format > Mask With Shape.
2 Click Group in the toolbar (or choose Arrange > Group). Note: Locked objects can’t be grouped. To ungroup a grouped object: m Select the object and click Ungroup in the toolbar (or choose Arrange > Ungroup). Note: If you group an object that has a build effect assigned to it, the effect is removed. Ungrouping a grouped object with a build assigned to it removes the build effect.
This textured foreground with photo corners and a white border is an alpha-channel graphic. The area between the photo corners is a transparent alpha channel. Your photograph is placed behind the alpha-channel graphic and can be seen through its transparent region, so it appears that the photo is in the photo-corner frame. To place an image behind a photo cutout window in a Keynote theme: 1 Drag your image from the Media Browser or the Finder to a cutout window on the slide canvas.
Including Sound and Other Media You can add sound files to your project so that, for example, recorded music plays throughout your slideshow or a narration accompanies each slide. You can also add video or Flash movies that play within a slide. Note: Some media files are protected under copyright law. Also, some downloaded music may be played only on the computer where the download occurred. Make sure you have permission to use the files you want to include.
Choose iTunes, iPhoto, or Movies. Select a playlist. Drag an audio file to a slide or to the Audio well in the Document Inspector. Search for a file by name. To open the Media Browser: m Click Media in the toolbar (or choose View > Show Media Browser). To add an image from iPhoto: 1 Click Media in the toolbar (or choose View > Show Media Browser). 2 Choose iPhoto from the Media Browser pop-up menu and select the album you want. 3 Drag an image file directly to the Keynote document window.
To add sound to a slide, do one of the following: Â Click Media in the toolbar, choose iTunes from the pop-up menu, select a playlist, and drag a file to the slide canvas. Â Drag a sound file from the Finder to the slide canvas. You can more finely control when music starts and stops by moving it on or off the screen in an object build. To learn more about producing object builds, see “Creating Object Builds” on page 145.
To add a soundtrack: 1 Open the Document Inspector. The Document Inspector button Drag a sound file here to play it throughout the slideshow. To repeat the sound file, choose Loop. Set the volume for the soundtrack. Preview your audio file. 2 In the Audio area, click iTunes Library. 3 Drag an audio file or playlist from the Media Browser to the Audio well in the Document Inspector. Note: You can also drag a sound file from the Finder.
Note: To ensure that the audio plays on other computers, “Copy audio and movies into document” must be selected in the expanded Save dialog. This option is on by default. When your slideshow plays, the movie starts the moment the slide appears. A movie control panel appears on the presenter display, but its controls vary depending on the size of your movie. For details, see “Viewing Movies” on page 159.
To set the movie poster frame: 1 Click the movie to select it. 2 In the QuickTime Inspector, drag the Poster Frame slider until the movie displays the image you want. Adding Webpages and Hyperlinks You can display a snapshot of a webpage (called a “web view”) on a slide. When the document is opened or the slideshow starts, Keynote can automatically update the snapshot with the current webpage. (The computer running the slideshow must be connected to the Internet.
If you don’t select “Update automatically,” you can update the webpage at any time by clicking Update Now. The webpage image is imported at full size, but you can resize and reposition it the same way you would with any other object. (The webpage image stays at the same resolution, but you can resize the web view to display less of the image.) The webpage image is automatically a hyperlink, which you can click during a presentation to open the webpage in a browser.
Turn text or images into hyperlinks that open another slide, a Keynote document, a webpage, or an email message. The blue arrow (visible only in edit mode) means the item is a clickable hyperlink. To add a hyperlink: 1 Select the text, shape, image, or movie you want to turn into a hyperlink. 2 In the Hyperlink Inspector, select “Enable as a hyperlink” and choose an option from the Link To pop-up menu. 3 Enter the required information.
Use this type of hyperlink To perform this action Notes Email Message Open a new mail message with the specified subject and addressee Keynote opens your default mail application. Exit Slideshow Stop the slideshow Keynote opens in edit mode to the last slide shown. Drag a URL from a browser to an object on the slide canvas to create a web view hyperlink. By default, any text you type or drag that begins with “www,” “ftp,” or “http” automatically becomes a hyperlink as well.
During a presentation, the pointer appears only on slides with hyperlinks. You can change this default so that the pointer appears whenever the mouse moves. To specify when the pointer appears during a presentation: 1 Choose Keynote > Preferences. 2 Click Slideshow. 3 Choose one of the “Show pointer” options. Modifying Layouts Certain slide elements—such as a body text box and object placeholders—are preformatted and located in specific places on each master slide.
If none of the available master slide layouts meets your needs, you can create your own master slide with whatever elements you want on it, and then create a new slide based on that master. If you are going to create a number of slides that include a graphic, you can add a “placeholder” box to contain it. You can also add a slide number. To learn how to design your own master slide layouts, see Chapter 9, “Designing Your Own Master Slides and Themes.
 Color Fill: Gives the background a single, solid color. Click the color well and choose a color in the Colors window.  Gradient Fill: Colors the background with a color gradient. Click each color well and choose colors in the Colors window.  Image Fill: Uses your own image as a background. Click Choose and select an image.  Tinted Image Fill: Uses your own image with a semi-opaque color tint over it. Click Choose and select an image.
4 Changing Object Properties 4 This chapter describes more advanced features for enhancing graphics and other objects in your presentation. You can directly manipulate object properties such as color, line style and thickness, shadow, opacity, and orientation using the inspectors and the Colors window. You can adjust the brightness, color, and other properties of images. You can also draw custom shapes and modify both predrawn and custom shapes. This chapter tells you how.
The color selected in the color wheel appears in this color well. Use the slider to show lighter or darker hues in the color wheel. Click to select a color in the color wheel. Drag colors from the color well to store them in the color palette. Drag the handle to open the color palette. You can use the color wheel in the Colors window to select colors. Your color selection appears in the well at the top of the Colors window. You can save that color for future use by placing it in the color palette.
To apply a color to an object on the slide canvas, do one of the following: Â Select a color well in one of the inspectors, and then click a color in the color wheel. Â Drag a color from the color palette or color box to a color well in one of the inspectors. Â Drag a color from the color palette to an object on the slide. Filling an Object with Color Objects can be filled with a solid color or a color gradient, in which two colors gradually blend with each other.
To set the solid fill color of an object: 1 On the slide canvas, select the object whose color you want to change. 2 In the Graphic Inspector, choose Color Fill from the Fill pop-up menu. 3 Click the color well below the Fill pop-up menu to open the Colors window. 4 Select a color in the Colors window. To fill an object with a color gradient: 1 On the slide canvas, select the object whose color you want to change. 2 In the Graphic Inspector, choose Gradient Fill from the Fill pop-up menu.
Use the pop-up menu to set a scaling option for the image within the object. To change the image, drag a file from the Media Browser or the Finder into the image well. 4 Choose a scaling option from the pop-up menu. Â Scale to Fit: Resizes the image to fit the object’s dimensions as well as possible. If the object’s shape is different from that of the original image, parts of the image may not appear; blank space may also appear around the image.
Tile (small image) Tile (large image) Changing Border Style and Color For drawn objects (shapes), chart elements, and table cells, you can choose a style and color for the object’s border, or you can specify no border. You can also put a border around imported images. You set border line style and color using the Graphic Inspector and the Colors window. To set the line style and color of an object’s border: 1 Select the object that you want to modify.
Positioning Lines You can set the precise position of a line using the Metrics Inspector. To set the precise position of a line: 1 Select the line. 2 In the Metrics Inspector, enter the X and Y coordinates to specify where you want the line to start and end. Adding Shadows Shadows give your page an appearance of depth. An object’s shadow appears on any object behind it. You can create a variety of shadow effects, or remove the shadow from an object. Select the checkbox to add a shadow to a selected object.
4 Adjust the shadow offset by typing a number in the Offset box. A high shadow offset value makes an object’s shadow appear longer and slightly separated from the object. 5 Set the shadow blur by typing a number in the Blur box. A high blur value makes the object’s shadow appear more diffuse; a low value gives the shadow more sharply defined edges. 6 Set the shadow opacity by typing a number in the Opacity field.
Adjusting Opacity You can create interesting effects by making objects more opaque or less opaque. When you put a low-opacity object on top of another object, for example, the bottom object shows through the top object. Depending on how high or low you set the opacity, the objects beneath can be highly visible, partly obscured, or completely blocked from view (at 100-percent opacity).
Adjusting Images For images, including those you use to fill a shape, you can change the brightness, contrast, and other settings to improve the quality of an image or to create interesting effects. Adjustments you make don’t affect the original image; they affect only the image’s appearance in Keynote. To adjust an image: 1 Select the image. 2 Click the Adjust button in the toolbar (or choose View > Show Adjust Image) to open the Adjust Image window. Adjust the contrast of light and dark tones.
 Contrast: Makes different parts of the image stand out. You can make shadows darker, sharpen the edges of objects, and make colors stand out more. If you increase the contrast for a photo a lot, it looks more like an illustration.  Saturation: Adjusts color vibrancy by deepening or lightening colors.  Temperature: Acts as a kind of “white balance” corrector. You can introduce more warmth (more orange tones) or coolness (more blue tones).  Tint: Changes the amount of red or green tones in the image.
The name of the selected image or movie appears here. Resize objects to exact dimensions by specifying height and width. Click to return a resized object to its original size. Place an object precisely on the canvas by specifying X and Y coordinates. Flip an image sideways or upside down using these buttons. Rotate an object with this wheel. To flip or rotate an object: 1 Select the object you want to rotate.
Changing an Object’s Size and Position In addition to dragging objects and their selection handles, you can use the Metrics Inspector to make precise adjustments to the size and position of objects on the canvas. To set the precise size of an object: 1 Select the object you want to resize. 2 In the Metrics Inspector, type a number in the Width and Height fields (or click the arrows to increase or decrease the number).
5 Creating Tables 5 Use tables to organize and sort information, create interesting layouts, and perform calculations on numeric data. This chapter covers basic table design and use. Keynote provides powerful features for making attractive, compelling tables that can contain text or graphics. You can also use a table to present numeric data, complete with formulas and number formatting. Adding a Table Add a table when you want to organize information or compare sets of data.
You can also draw a table on the slide canvas. To draw a table on the slide canvas: 1 Hold down the Option key and click Table in the toolbar. 2 Release the Option key, and then move the pointer over the slide canvas until it becomes a crosshair. 3 Drag across the slide canvas to create a table any size you want. To size the table from the center, continue to hold down the Option key while dragging the crosshair pointer across the canvas.
The Table Inspector button Type the number of table rows and columns. Select to add a specially formatted header row or column. Add or delete rows or columns, merge cells, split rows, or split columns. Select to make rows resize to accommodate content. Select table columns, rows, and borders. Specify column width and row height. Working With Table Cells and Borders You enter text in a table cell by selecting the cell and typing in it.
Use the steps described here to select cells and to move from cell to cell. You can also use the selection buttons in the Table Inspector. To read about the Table Inspector, see “Formatting Tables” on page 98. To learn about selecting cells when using formulas, see “Using Formulas” on page 110. To select the entire table, do one of the following: Â Click the table. Â If a table cell is already selected, press Command-Return to select the entire table. Selection handles appear on the edges of the table.
To select a discontinuous group of table cells: m Hold down the Command key as you select cells. Use Command-click to deselect a cell in the group. To select an entire row or column: 1 Click the Inspector button in the toolbar (or choose View > Show Inspector), and then click the Table Inspector button. 2 Select a cell in the row or column you want to select. 3 Click Row or Column (at the bottom of the Table pane). Selecting Table Cell Borders Follow these steps to select table cell borders.
Entering and Editing Content in Table Cells You enter text by typing in a cell. You can then edit the text by selecting it and making any changes you want. To type content in a table cell: m If the cell is empty, select it and begin typing. To replace specific text already in the cell: m Select the cell, and then double-click what you want to change. Begin typing. To replace everything in the cell: m Select the cell and begin typing.
Using Table Formatting Controls You can do basic table formatting—including merging and splitting cells, adding and deleting rows and columns, and adding or removing the header row and column— using a table formatting menu or the Table Inspector. To open table formatting menus, do one of the following: Â Select a table or cell(s), and then open the Table Inspector and use the Edit Rows & Columns pop-up menu in the Table pane. Â Select a table or cell(s), and then choose Format > Table.
 To add or remove rows, type the total number of rows you want in the table in the Rows field and press Return. Rows are added to or removed from the bottom of the table.  To add or remove columns, type the number of columns you want in the Columns field and press Return. Columns are added to or removed from the right side of the table. To delete table rows or columns: 1 Select the row or column or a cell in it.
Splitting cells divides each selected cell into two equal parts, horizontally (rows) or vertically (columns). Both of the new cells have identical background colors or images. Any text that was in the original cell remains in the topmost or leftmost cell. You can split and merge cells using the Edit Rows & Columns pop-up menu in the Table Inspector or any table formatting menu. To resize table cells, use controls in the Table pane of the Table Inspector.
You can also Control-click the table to show the table menu and choose Split Into Rows or Split Into Columns (or choose Format > Table > Split Into Rows or Split Into Columns). Â To split cells into rows, choose Split Rows. Â To split cells into columns, choose Split Columns. You can repeat the split operation to create smaller and smaller units within a table cell. To rejoin split cells: m Select the cells and choose Merge Cells from the Edit Rows & Columns pop-up menu in the Table Inspector.
Note: With this option selected, table rows automatically get bigger when text extends beyond a cell boundary, and adding rows or columns increases the outside dimensions of the table. As text is removed from a cell, the row height may decrease (if the cell determines the row height). If “Automatically resize to fit content” is not selected, Keynote tries to keep the outside dimensions of the table the same when you add rows and columns.
To adjust the space around text within a table cell: 1 Click in the cell (or select the table to apply the same setting to all cells). 2 In the Text pane of the Text Inspector, drag the Inset Margin slider to the right to increase the space, or enter a value in the field and press Return. Formatting Cell Borders You format cell borders the same way you format other graphics. You can change the line thickness and color of cell borders, or you can hide the cell border of any cell.
To create a table with no outside borders: 1 Select the table. 2 In the Table pane of the Table Inspector, click the second Borders button to select the outside borders. 3 In the Graphic Inspector, choose None from the Stroke pop-up menu. Adding Images or Background Colors You add images or color to a table cell using the Fill pop-up menu in the Graphic Inspector. You can add images or color to individual table cells, or to the entire table.
To add a background color or gradient fill: 1 Select a table cell, a group of cells, or the whole table. 2 In the Graphic Inspector, choose Color Fill or Gradient Fill from the Fill pop-up menu. 3 Click a color well and select a color in the Colors window. Note: If you add color to the entire table, the Fill pop-up menu in the Graphic Inspector displays None when you select an individual table cell. For more details about working with color and gradient fills, see “Using Color and Image Fills” on page 80.
Select to define a display format for numbers in selected cells. Select whether to use a thousands separator. Choose or type a symbol to follow numbers. Select a style for displaying negative numbers. Set the number of decimal places to display. Choose or type a symbol to precede numbers. When you use the % suffix, data in the cell is followed by the % symbol. If the data in the cell is used in a formula, it’s converted into a decimal number. For example, 3% becomes 0.03.
To edit a value in a cell that has a number format: 1 Select the cell. 2 Click in the cell or press Return or Enter. The Formula Editor opens, displaying the value but not its formatting. 3 Change the value displayed in the Formula Editor. Accept button Save changes. Make changes. Cancel button Discard changes. 4 To retain the new value, click the Accept button in the Formula Editor, press Return, or click outside the editor.
Sort selected column cells in ascending order. Rows containing the cells will be reordered. Sort selected column cells in descending order. Rows containing the cells will be reordered. The following table describes how different types of data are sorted in ascending or descending order.
Autofilling doesn’t set up an ongoing relationship among cells in the selection. After autofilling, you can change the data, number formatting, or formula in any of the cells in the selection. To autofill a range of cells: 1 Select the cell whose data, number formatting, or formula you want to paste into other cells. 2 Select adjacent cells to autofill, making sure that the cell whose contents you want to paste is the upper-left cell in the group.
Following are guidelines for using basic formulas in tables. See “Operators and Functions for Advanced Users” on page 118 for information about working with more advanced formulas. Adding a Quick Formula The easiest way to perform a basic calculation using values in a range of adjacent table cells is to add a quick formula using the Table Inspector’s Quick Formula pop-up menu. Â Sum: Totals the values in the cells. Â Average: Calculates the arithmetic mean of the values in the cells.
2 Click Inspector in the toolbar, click the Table Inspector button, and click Numbers. 3 Choose a formula from the Quick Formula pop-up menu. Keynote places the formula and its result in the first empty cell to the right of the selected cells. If there is no empty cell, Keynote creates a new column to hold the result. If the row has a header cell and you want the formula to use all the values in the row, click the header cell before choosing the quick formula.
 Select a table cell that contains a formula, and click in the cell or press Return or Enter.  Select a table cell, click Inspector in the toolbar, and click the Table Inspector button. In the Numbers pane, click the Formula Editor button (=). To add a new formula using the Formula Editor: 1 Select the cell in which you want to display the result of the formula. 2 Open the Formula Editor. For example, type the equal sign (=).
Using Cell References When the Formula Editor is open, cell reference tabs appear on the table’s top and left sides. Columns are referenced alphabetically. This is cell D4. Rows are referenced numerically. The reference tabs help you quickly create a cell reference. A cell reference identifies a column (using letters) and a row (using numbers). For example, A1 is the upper-left cell. A4 is the cell in the fourth row of the first column.
To add a reference to a range of cells: m Select a function from the Insert Formula button in the Formula Editor. Drag over the cells you want to add. The Formula Editor inserts the first and last cell references of the range, separated by a colon (A2:A4). See “Using Predefined Functions” on page 116 for more information about the Insert Formula button. You can also type or click the first cell, type a colon, and then type or click the last cell.
Performing Arithmetic Operations To create a formula that performs an arithmetic operation, you use arithmetic operators. For example, to add the values in two columns, you could create a formula that looks like this: A2 + A3 + A5. Here are the basic arithmetic operators. For complete information about operators in Keynote, see “Defining Formulas That Use Operators” on page 118.
Here are some examples of formulas that use functions: Â SUM(A2:A10): This formula uses the SUM function to add values in nine cells of the first column. There is one argument, A2:A10. The colon means the function should use the values in cells A2 through A10. Â AVERAGE(A2,B2,C2): This formula uses the AVERAGE function to compute the arithmetic mean of three values in the second row. There are three arguments: A2, B2, and C2. Here’s a summary of the functions you can add using the Insert Formula button.
For example, to refer to nine cells in column A (A2 through A10), you could drag from cell A2 to cell A10. You can also: a Click or type A2. b Type a colon. c Click or type A10. 5 Click the Accept button or press Return or Enter to save the formula. Operators and Functions for Advanced Users After becoming familiar with the Formula Editor and cell references, you can create a wide variety of formulas.
Example (A2 contains 20 and B2 contains 2) This operator Returns / The result of dividing one value by another value A2/B2 returns 10 ^ The result of raising one value to the power another value A2^B2 returns 400 % The result of dividing a value by 100 A2% returns 0.2 Notes: Â When a cell reference points to an empty cell, 0 is the value used. Â When a cell reference points to a cell containing FALSE, 0 is used. If the cell contains TRUE, 1 is used. For example, TRUE + 1 returns 2.
Defining Formulas That Use Functions The following tables provide information about the three kinds of functions: statistical, numerical, and logical. In the tables, these conventions are used to describe arguments: Â The argument placeholders—x, x1, and so forth—represent places where input to the functions (such as cell references or constants) should go. Â The ellipsis (...) following a list of arguments means you can use additional arguments if needed.
Numerical functions perform arithmetic calculations. This function Returns Examples Notes ABS(x) The absolute value of the argument ABS(3.6) returns 3.6 ABS(–3.6) returns 3.6 ABS(TRUE) returns 1 Interprets TRUE as 1 and FALSE as 0 INT(x) The whole number nearest the argument that is no larger than the argument INT(3.1) returns 3 INT(3.7) returns 3 INT(–3.
Logical functions determine whether a particular condition is TRUE or FALSE. This function Returns Examples Notes AND(x1 ...) TRUE if all the arguments are TRUE, otherwise returns FALSE AND(TRUE, TRUE) returns TRUE AND(TRUE, FALSE) returns FALSE AND(TRUE, 0) returns FALSE See note at end of table.
6 Creating Charts 6 You can turn spreadsheet data into attractive charts. This chapter outlines the basics of creating charts in Keynote. Keynote provides tools for creating your own visually appealing charts to present numerical data. You can copy and paste data from a spreadsheet or type it directly into the Chart Data Editor to create and edit your charts right on the slide canvas. By default, Keynote coordinates the appearance of your charts with the theme you’re using.
These squares indicate which color represents each data series. The colored squares next to the row labels (Region 1 and Region 2) show which color represents each data series in the chart. The illustration below shows how this data looks as a column chart. The chart legend denotes the two data series. The data sets contain one data point (one bar) from each of the data series. These four bars represent one data series.
Transposing Data Series and Data Sets You can easily switch the data series and data sets in your charts—without having to retype the data—by using the Plot Row vs. Column button in the Chart Data Editor. This button makes the columns of data in the Chart Data Editor the data series. This button makes the rows of data in the Chart Data Editor the data series. The column chart below shows the same data, but with the data sets and data series transposed.
These two bars represent one data series. The data sets contain one data point (one bar) from each of the four data series. For this chart, the data series are represented by columns in the Chart Data Editor pictured on page 124. There are now four data series represented as four differentcolored bars. Data series are represented differently in the different kinds of charts provided by Keynote.
Adding a Chart You can add a chart by inserting it on the slide canvas or by drawing it. After you add a chart, you can change the chart type and appearance with the Chart Inspector. To place a chart on the slide canvas: 1 Click Chart in the toolbar (or choose Insert > Chart). A chart containing placeholder data appears on the slide, and the Chart Inspector and Chart Data Editor open. To resize the chart: m Drag an active selection handle.
The Chart Inspector button Choose a chart type from the pop-up menu. 2D charts are on the left, and 3D charts are on the right. To change a chart from one type to another: 1 Select the chart. 2 In the Chart Inspector, choose a different chart type from the pop-up menu. You can also choose Format > Chart > Chart Type > [chart type]. Â If you switch to a pie chart, Keynote charts only the first data set in the Chart Data Editor. See “Pie Charts” on page 136.
 Depending on the type of chart, the attributes that may change when you change a chart’s type are as follows: show value label, value label position, text style, series stroke, series shadow, series fill, data point symbol, and data point fill.  Bar/column charts and stacked bar/column charts share attributes except for value label position. Also, bar/column charts have separate fills.  3D chart shadows are shared across chart types.
To copy data from another spreadsheet into the Chart Data Editor: 1 Open the spreadsheet with the data you want, and select all the relevant cells. 2 Choose Edit > Copy (or press Command-C). 3 Select the top cell in the first column of the Chart Data Editor. 4 Choose Edit > Paste (or press Command-V). To edit the names of rows and columns, or the data in a cell: m Double-click a cell or a row or column label and type.
The Chart Inspector button To open the shortcut menu for a chart: m Hold down the Control key and click a chart. To hide the chart legend: 1 Select the chart. 2 In the Chart Inspector, deselect the Show Legend checkbox. You can also select the legend and press Delete; you can always display the legend again by selecting Show Legend in the Chart Inspector. Setting Chart Colors You can format the bars, wedges, and area shapes that appear on each type of chart just as you format any other drawn object.
For more information about changing object properties, see Chapter 4, “Changing Object Properties.” Changing Chart Fonts You can change the fonts and text colors used for axis labels, data point labels, and legends. To change chart fonts: 1 Select the text you want to change. To change the font on all chart elements, click the chart to select it. If you select the text for one data point or axis label, all the text of that kind is also selected. You change the font for a chart legend separately.
Show or hide axes and chart borders (2D charts only). Set the text direction for the series axis labels. Place tick marks along the X-axis. Show or hide the X-axis gridlines. To show or hide axes and chart borders: 1 Select the chart. 2 In the Chart Inspector, click the Axis button if it is not already selected. 3 Choose one or more items in the Axes & Borders pop-up menu to select it. A selected item has a checkmark next to it; choose the item again to deselect it.
To specify units for axis values: 1 Select the chart. 2 In the Chart Inspector, click the Axis button if it is not already selected. 3 Below Number Format, type text in the Prefix or Suffix field (or choose a symbol from the pop-up menus). Placing Grid Labels and Tick Marks The X-Axis and Y-Axis pop-up menus in the Axis pane of the Chart Inspector provide an array of options for placing tick marks, labels, and gridlines along the value axis or the series axis.
Show or hide value axis labels. Place tick marks along the Y-axis. Show or hide the Y-axis gridlines. Formatting the Elements in a Data Series You can use a variety of visual effects to enhance the appearance of data series elements. To add data point labels: 1 Select the chart or an element in a data series. For all chart types except pie charts, selecting one element (such as a bar) of a series automatically selects the full series. For pie charts, you can select individual wedges.
Pie Charts For pie charts, Keynote charts only the first data set in the Chart Data Editor (the first data point for each data series). If the data series are in rows in the Chart Data Editor, only the first column is charted; if the data series are in columns in the Chart Data Editor, only the first row is charted. Thus, one pie chart represents a single data set, and each wedge is one element in that set. Other data sets in the Chart Data Editor are maintained, but they are not displayed in the pie chart.
Separate individual pie wedges. Add shadows to individual wedges or the whole pie. Set a pie wedge apart by using the Explode slider and giving it a series name. You can put shadows on individual pie wedges or on the pie as a whole. Putting shadows on individual wedges makes it look like the wedges are in different layers. To put shadows on individual pie wedges: 1 Select the chart or individual wedges. 2 In the Chart Inspector, click the Series button. 3 Choose Individual from the Shadow pop-up menu.
To rotate a pie chart: m Select the chart and drag the Rotation Angle wheel in the Series pane of the Chart Inspector, or type a value in the Rotation Angle field. Bar and Column Charts You can apply shadows to individual data series or to the entire chart. You can adjust the opacity for the chart as a whole or for individual series (not individual bars). You can also adjust the spacing between data sets or individual bars. To adjust spacing between individual bars or data sets: 1 Select the chart.
To adjust the opacity of a chart: m Select the chart and drag the Opacity slider in the Graphic Inspector. For more information, see “Adjusting Opacity” on page 88. Area Charts and Line Charts In area and line charts, you can use symbols—circles, triangles, squares, and diamonds—to represent data points. The data points in this series are represented with circles. The data points in this series are represented with triangles.
For more information about using the Graphic Inspector to set line color, shadow, and the fill for data point symbols, see Chapter 4, “Changing Object Properties,” on page 80. Scatter Charts Scatter charts display data differently from the other kinds of charts. They require at least two columns of data to plot values for a single data series. To show multiple data series, you use additional two-column pairs. Each pair of values determines the position of one data point.
To control the appearance of a scatter chart, do one of the following: Â To format a symbol for a data series, choose a symbol from the Data Point Symbol pop-up menu in the Series pane of the Chart Inspector. You can adjust the stroke and fill settings of a scatter plot data point symbol by using the Graphic Inspector. Â To specify axis settings, use the Axis pane of the Chart Inspector. Because both axes of scatter charts have values, value axis format settings apply to both X-axis and Yaxis.
To define 3D scene settings: m Select a 3D chart, click the 3D Scene button in the Chart Inspector, and modify the chart’s viewing angle and lighting style using the 3D Scene controls. Click the intersection of the arrows and drag to move the chart both ways. Choose an item from the Lighting Style pop-up menu to adjust the lighting effect. Drag an arrow to adjust the viewing angle. Click one arrow at a time to move the chart in a single direction (left-right or up-down).
7 Slide Transitions and Object Builds 7 This chapter describes how to add motion and visual appeal to your slideshow using slide transitions and object builds. After you’ve designed and organized your slides, you can put the whole presentation together. Add animation to text to captivate your audience. Add transitions to move smoothly from one slide to the next. Use object builds within each slide to reveal data as you present it.
You can change the duration of a transition, and you can specify when to start the transition (automatically or on click). You set slide transitions in the Slide Inspector. The Slide Inspector button Click to preview the transition. Choose a transition. Set how much time it takes to complete the transition. Set how much time to wait until transitions that start automatically begin playing. Set the transition direction. Choose how to initiate the transition.
6 Choose an option from the Start Transition pop-up menu. Â On Click: Initiates the transition when you click to move to the next slide. Â Automatically: Initiates the transition after the amount of time specified in the Delay field. Note: If you select “Scale slides up to fit display” in the Slideshow pane of Keynote preferences, parts of Cube or Flip transitions may not be visible.
Click to preview the build. Use Build In animations to move slide elements onto the screen, and Build Out animations to move elements off the screen. Set the animation style, direction, and build order for each object. Set how long it takes to complete the build. Open the Build Order drawer to reorder objects. Move objects onscreen or offscreen in specific groups. 3 Select an item on the slide and choose an option from the Effect pop-up menu.
Working With Object Builds After you’ve set up object builds on a slide, you can create various effects by changing the order of builds and by specifying timing for the appearance of builds. To build objects in a different order: 1 In the Build Inspector, click the More Options button. 2 In the Build Order drawer, drag the items to change their order. You can also use the Order pop-up menu to change the order of builds.
Drag items to reorder them. Choose how to initiate the selected build. Specify how long to wait after the previous build finishes to start the object build. You can also make several objects appear and move at the same time, by first grouping them (see “Grouping and Locking Objects” on page 65). 3 To specify how long to wait after the previous build finishes to start the next object’s build, type a value in the Delay field (or click the arrows). You can specify a delay up to 60 seconds.
Interspersing Build Elements After you’ve set up object builds on a slide, you can create various effects by changing the order of builds and by specifying timing for the appearance of builds. For example, you can set up a build that brings the first text bullet onto the slide, then the first wedge of a pie chart, and then the second bullet. You can do the same to move objects off the slide. You can also specify a range of elements to be used in a build, such as only the second and third text bullets.
 By Bullet: Moves text bullet by bullet.  By Bullet Group: Moves each bullet and its subordinate bullets together.  By Highlighted Bullet: Highlights each bullet as it moves, leaving only the most recent bullet highlighted. Choose an effect to make text appear or leave the slide. Choose how to move text on or off the slide. Creating Table Builds You create object builds for slides with tables the same way you create any other object build.
 By Row Content: Moves the entire empty table onto the screen, and then inserts the content row by row.  By Column Content: Moves the entire empty table onto the screen, and then inserts the content column by column.  By Cell Content: Moves the entire empty table onto the screen, and then adds the content cell by cell. Note: All elements of a table use the same build style.
You can assign a chart legend its own build style and order. To make the legend appear with the chart, group it with the chart before you set the chart’s build style (see “Grouping and Locking Objects” on page 65). Creating Builds on Master Slides You can add object builds to a master slide so that build effects appear on every slide you create using that master.
8 Viewing, Printing, and Exporting Your Slideshow 8 This chapter describes the various ways to share your Keynote presentation. You can view a Keynote presentation from your computer on your own display or projected on a large screen. You can make the slideshow a self-running “movie” for a kiosk. You can share it across platforms by exporting it to formats such as a QuickTime movie, PowerPoint presentation, Flash file, or PDF document.
In a self-playing presentation, transitions or builds set to begin automatically occur just as they do during a normal presentation. If a self-playing presentation includes transitions and builds set to begin on click, they will also occur automatically, after waiting the amount of time specified in the Delay fields in the Document Inspector. The values you specify in the Delay fields apply to all transitions and builds set to begin on click.
2 In the Document pane of the Document Inspector, select the checkbox labeled “Automatically play upon open.” 3 To make the presentation play repeatedly (until the viewer quits by pressing the Escape key, for example), select “Loop slideshow.” 4 Choose File > Save. To require a password to exit a slideshow: m In the Document pane of the Document Inspector, select the checkbox labeled “Require password to exit show.
Note: Selecting this option may cause your slideshow to run more slowly and animations to display poorly. Viewing Full-Screen Presentations Full-screen presentations make the most of the crisp graphics and smooth animations made possible by Keynote. You can show full-screen presentations directly on your computer’s display, on a secondary display, or projected onto a large screen. Viewing on Your Display The simplest way to view a slideshow is by watching it directly on your computer’s display.
When you’re rehearsing with a single display, the presenter display shows the information you specified in Presenter Display preferences. Comments are visible in the presenter display if they’re visible on the slide while editing. Viewing on a Projector or Second Display If you have a larger audience, you may want to play the slideshow on a second display or project it onto a large screen.
Choose where slides display during a slideshow with a dual-display setup. 2 Select “Present on primary display” or “Present on secondary display.” The primary display is the one with the menu bar. If you choose “Present on secondary display,” you can customize what the presenter sees on the primary display. See “Customizing the Presenter’s View” on page 160. 3 Click Play in the toolbar (or choose View > Play Slideshow).
3 Choose the same settings for both displays from the Resolutions field and the Colors pop-up menu. 4 Click Arrange and select Mirror Displays. To play your slideshow on a mirrored system: 1 Open the Keynote document. 2 Choose View > Play Slideshow (or click Play in the toolbar). 3 To advance to the next slide or object build, press the Space bar or click the mouse. Note: Keynote generally plays back very smooth animations.
Setting Presentation Options You can set many options for your presentation, such as whether the pointer appears and what happens after the last slide. You can also set up the presenter’s display to show such information as elapsed time and the next slide.
Controlling a Presentation With the Keyboard You can use the keyboard to navigate through a presentation. (For a complete list of presentation keyboard shortcuts, choose Help > Keyboard Shortcuts.) During a presentation, you can see a list of keyboard shortcuts that work in presentation mode. To show (or hide) the Presenter Keyboard Shortcuts window: m During a presentation, press the Help or question mark (?) key on your keyboard.
 To close the slide switcher without changing the current slide, press Escape. When an object build is running on a slide, a red line appears on the display to warn you not to move to the next slide. The line turns green when the build is complete. Pausing and Resuming a Presentation There are several other ways to pause a presentation. To pause a presentation, do one of the following:  To pause (freeze) the presentation and display the current slide, press F. To resume the presentation, press any key.
You can also specify a custom size by choosing “Custom slide size” in the Slide Size pop-up menu and then typing the dimensions you want in the Width and Height fields. Note: You must use the “Custom slide size” pop-up menu to specify a custom slide size. You cannot specify a custom size in the Theme Chooser.
To print slides: 1 Choose File > Print. 2 In the Print dialog, choose Keynote from the Copies & Pages pop-up menu. Select which layout of slides and handouts you want to print. Choose Keynote from this pop-up menu. Select print formatting options. Convert the set of slides to a PDF file. 3 Select a print option. Â Individual Slides: Prints one slide per page. Â Slides With Notes: Prints one slide per page with slide notes.
 Print each stage of builds: Prints one slide image for each stage of an object build. (A slide with a three-stage object build prints as three slides.)  Include skipped slides: Prints all the slides in the slide organizer, even if they are marked as skipped.  Add borders around slides: Prints a line around the edges of each slide.  Include slide numbers: Prints the number at the bottom of each slide.  Include date: Prints the date on each slide.
Choose an interactive movie or a self-playing movie. For self-playing movies, set slide and object build durations. Play the movie once, repeatedly (loop), or forward and backward. Choose a compression format to optimize movie size and playback quality. Select if the slideshow includes transparency you want to preserve.
 Repeat: Sets the way self-playing slideshows continue to play. Choose Loop to play the show continuously. Choose “Back and Forth” to have the slideshow run to the end, run backward toward the beginning, and then run forward again. Choose None if you want the slideshow to play only once.  Enter full screen mode when opened: Sets the slideshow to appear on the whole screen, rather than in a window. 4 For a self-playing movie, you can choose an option from the Repeat pop-up menu.
Note: Windows and Mac OS X don’t handle graphics in the same way, so you may notice slight variations in your slideshow graphics when you open an exported PowerPoint document on a Windows computer. PDF Files Your slideshow can be converted to a PDF file, which can be viewed or printed in Adobe Acrobat Reader or any PDF application. There are two ways to save your Keynote slides as PDF files. If you intend to view the PDF file online, use the Keynote Export command.
4 To export images to iPhoto 5 or later, select “Export images into iPhoto,” name the new album, and click OK. 5 Choose an option from the Format pop-up menu to specify the image quality you want. The better the quality, the larger the file size. If you choose “Variable quality” (JPEG only), use the Quality slider to specify a percentage between low and high quality. 6 Click Next, type a name, specify a location for the image files, and click Export.
HTML You can export your slides to an HTML document that can be viewed with Safari or another web browser. Viewers click hyperlinks to advance the presentation. To export slides to an HTML document: 1 Choose File > Export. 2 Click HTML and specify whether you want to export all the slides or a range of slides. 3 To create a separate image for each build stage, select “Create an image for each stage of builds.
5 If you don’t want to include audio and movie files in the export, click Advanced Options, and deselect “Copy audio and movies into document” (this option is on by default). 6 Click Save.
9 Designing Your Own Master Slides and Themes 9 This chapter is for designers who want to use the powerful graphics capabilities in Keynote to create their own master slides and themes. This chapter assumes you are already familiar with the Keynote design and formatting features described in previous chapters. The themes that come with Keynote are sets of master slide layouts, backgrounds, charts, tables, and text styles.
You can also modify and save a whole set of master slides to create your own theme, customizing it with your company logo or styling it with your own designs. If you want to save a set of customized master slides to use in other presentations, you can save the set as described in “Saving a Custom Theme” on page 180. To work on a master slide: m Open the master slide organizer and select a master slide.
 Choose Edit > Duplicate. You can modify master slides using the Master Slide Inspector. To open the Master Slide Inspector: 1 Select a master slide in the slide organizer. 2 Click Inspector in the toolbar (or choose View > Show Inspector), and then click the Slide Inspector button. 3 Click Appearance. Place title and body text boxes on master slides. Create a place for tables, charts, web views, and imported graphics to appear. Select to allow objects on slides to interleave with objects on the master.
 If you are building a completely new background, you may want to begin with a blank master.  If you want to retain a copy of the original master, do one of the following to create a duplicate of the master slide:  Choose Slide > New Slide.  Click New in the toolbar.  Choose Edit > Duplicate. 2 Select unwanted elements and press the Delete key. 3 Make your changes to the master.  Use Keynote tools to place background elements on the master slide.
Adding Alignment Guides You can create your own alignment guides to help you place your text and graphics consistently on each slide. Alignment guides created on a master slide are available when you are placing objects on any slides based on that master. To create alignment guides on a master slide: 1 In the Appearance pane of the Slide Inspector, select the master slide to which you want to add the alignment guides. 2 Click View in the toolbar and choose Show Rulers.
For information about setting line spacing, text indents, and tabs, see “Changing Text Alignment and Spacing” on page 47 and “Setting Tabs and Text Indents” on page 49. Applying Your Changes as You Work As you work on a master slide, you can try out your changes on a normal slide to get a better sense of how the new layout will look. By going back and forth between the “test” slide and the master slide, you can make fine adjustments, such as making lines longer or shorter or adding multiple indent levels.
Changing Default Styles for Text and Objects You can modify the default attributes of objects such as shapes, text boxes, tables, and charts. For example, you can set it up so that every time you click Table in the toolbar, the default table contains a certain number of rows and columns, has header and body text in a particular font, and has borders formatted with specific colors and line thicknesses.
Important: A table has four distinct formatting areas: header row, header column, inside borders, and outside borders. To make changes, you must set all the elements in a formatting area. For example, to set a new default for header rows you must change all the cells in the header row (not just one cell).
Saving a Custom Theme If you modify master slides in a theme and you want to use these modifications again in other slide presentations, you can save the modified theme as a custom theme. After you save your custom theme, it appears in the Theme Chooser. When you select your custom theme, it comes with all the master slides you defined. To save the current theme as a custom theme: 1 Choose File > Save Theme. 2 Type a name and choose a location for the theme.
Creating a Custom Theme If you want to create an entirely new theme that is not based on any of the existing Keynote themes, the easiest way is to start in a new Keynote document with only a single, blank master slide. Delete all other master slides from the document. Keep the following tips in mind: Â Design and place shared background elements and body and title text first. Â On a sample slide, test your text layouts to be sure they work with wrapped text lines.
+ symbol (clipping indicator) 59, 102 > symbol (in menu commands) 17 3D charts 141 A aligning bullets 52 objects 39–41 text 47 alignment guides 39–41 alignment guides, adding to master slides 176 “Allow objects on slide to layer with master” checkbox 175 alpha-channel graphics 66 Alternate Display checkbox 160 angle wheel 83 animation of text 149 AppleWorks, importing from 33, 61 arrow keys 96 arrows as line endpoints 85 shapes 54 aspect ratio 92 audio 43, 68, 70, 72 autofilling 109 automatically advancing
gradients 83 of charts 131 of objects 82 of slide background 79 of text 47 saving to use again 81 color palette 81 Colors window 31, 80 columns 52 comments 27 Constrain Proportions checkbox 92 context menus See shortcut menus copying audio and movies into a document 43, 68 theme images into a document 43 cropping.
G General preferences 25, 34, 43, 76 Go To command 42 gradient colors 83 Graphic Inspector 82–88, 105, 138 graphics adding 38, 60 adding to objects 83 adding to table cells 105 file formats 53 using PDF files as 61 graphs.
menus, shortcut (contextual) 32 Metrics Inspector 90–92 monitors.
resizing objects 92 resuming a paused presentation 162 Retain changes to theme defaults 180 rotating objects 63, 91, 138 rulers 39–41 changing unit of measure used 39 setting tabs 49 Rulers preferences 40–41 S saving a previous version 43 documents 43 sound and movies 43, 68 theme images 43 “Scale slides up to fit display” checkbox 145, 163 Scale to Fill 84 Scale to Fit 84 scatter charts 140 self-playing presentations 35, 153 Send Backward command 62 shadows 86 shapes 54–60 creating custom 54 editing a pol
selecting 96 tabs 49–50 technical support 18 text adding bullets 37 adding to a master slide 176 adding to shapes 59 adjusting indents 50 adjusting spacing 48 aligning 47 animating 149 building in stages 149 changing color 47 changing font 46 free text boxes 45 in charts 132 in tables 103 text columns 52 Text Inspector 46–51 Theme Chooser 34, 180 themes changing 34, 172–181 copying theme images into a document 43 resetting default 79 saving custom 180 selecting 33 setting default for new documents 34 using