
User`s guide


61
CHAPTER
6
6 Creating Charts
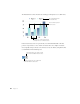
Use charts to display complex data visually. You can import data directly from your
spreadsheet into Keynote’s Chart Data Editor to create and edit stunning charts right on the
slide canvas. This chapter outlines the basics of placing and formatting a chart on a slide.
Charts can also be made to appear one part at a time as you make your points during your
slide presentation. To read about setting up such “object builds” for charts, see “Chart Builds”
on page 77.
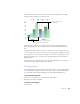
Many of the tasks described in this chapter can also be accomplished using shortcut menus
that are available right on the chart you’re working on.
To access shortcut menus for charts:
m Hold down the Control key and click a chart.
Adding a Chart
To place a chart on the slide canvas:
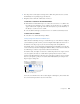
1 Choose Edit > Place > Chart (or click Chart in the toolbar). A chart appears on the slide
canvas. The Chart Inspector and the Chart Data Editor open.
2 Drag across the slide canvas to draw a default chart with placeholder data.
You can also hold down the Option key and click the Chart button in the toolbar. Then move
the pointer over the slide canvas until it becomes a crosshair. Drag across the slide canvas to
create a chart any size you want.