
Instruction Manual
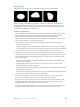
Table Of Contents
- Contents
- Chapter 1: Motion basics
- Chapter 2: Introduction to the Motion interface
- Chapter 3: Motion menus
- Chapter 4: Preferences
- Chapter 5: User interface controls
- Chapter 6: Create and manage projects
- Chapter 7: Basic compositing
- Chapter 8: Timeline
- Timeline overview
- Manage Timeline layers
- Manage Timeline layers overview
- Enable Timeline tracks
- Timeline track display
- Collapse and expand groups and layers
- Lock Timeline tracks
- Manage audio-video links
- Timeline view options
- Zoom in the Timeline
- Adjust Timeline track height
- Customize track display
- Name objects in the Timeline layers list
- Manage track order
- Nest groups and layers
- Add objects to the Timeline
- Edit objects in the Timeline
- Display and modify keyframes in the Timeline
- Work in the ruler
- Markers
- Mini-Timeline
- Chapter 9: Behaviors
- Behaviors overview
- Behaviors versus keyframes
- Browse for behaviors
- Where applied behaviors appear
- Use behaviors
- Modify behaviors
- Work with behaviors
- Behavior order of operations
- Modify behavior timing
- Combine behaviors with keyframes
- Animate behavior parameters
- Save and share custom behaviors
- Basic Motion behaviors
- Parameter behaviors
- Retiming behaviors
- Simulation behaviors
- Additional behaviors
- Chapter 10: Rigs and widgets
- Chapter 11: Final Cut Pro X templates
- Final Cut Pro X templates overview
- Template types
- How templates work
- Create and edit an effect
- Create and edit a title
- Create and edit a transition
- Create and edit a generator
- Use images in template placeholders
- Publishing parameters in templates
- Animation and timing in templates
- Template markers
- Template resolution
- Using masks in templates
- Template files and media save location
- Add multiple display aspect ratios to a template
- Tips for creating templates
- Chapter 12: Keyframing
- Chapter 13: Keying
- Chapter 14: Particles
- Particles overview
- Anatomy of a particle system
- Particle systems and layer sizes
- Create particle systems
- Adjust a particle emitter in the HUD
- Adjust a particle emitter and its cells in the Inspector
- Adjust a particle emitter in the Properties Inspector
- Particle Emitter Timing controls
- Create graphics for particle systems
- Animate objects in particle systems
- Use masks with particle systems
- Apply filters to particle systems
- Particle system examples
- Save custom particle effects to the Library
- Chapter 15: Replicator
- Replicator overview
- Anatomy of a replicator
- About replicator cell source layers
- Create a replicator
- Adjust a replicator and cells in the HUD
- Adjust a replicator and cells in the Inspector
- Adjust a replicator in the Properties Inspector
- Replicator Timing controls
- Use replicator onscreen controls
- Use image and geometry objects
- Animate replicators
- Animate replicators overview
- Apply behaviors to replicators
- Special behavior considerations
- Apply the Sequence Replicator behavior
- Add parameters to the Sequence Replicator behavior
- Adjust the Sequence Control parameters
- Sequence Replicator controls
- Use the Sequence Replicator Custom Traversal option
- Use Parameter behaviors with the Sequence Replicator behavior
- Display replicator animation curves in the Keyframe Editor
- Use replicators in 3D space
- Use masks with replicators
- Apply filters to replicators
- Save custom replicators to the Library
- Chapter 16: Text
- Text overview
- Set preferences for text
- Create text
- Use text files created externally
- Ways to edit text
- Text tools in the toolbar
- About fonts
- Text HUD
- Text Inspector
- Edit text format
- Edit text style
- Edit text layout
- Text Layout pane
- Layout controls in the Layout pane
- Text Rendering controls in the Layout pane
- Behavior controls in the Layout pane
- Type On controls in the Layout pane
- Path Options controls in the Layout pane
- Text path-related tasks
- Margins controls in the Layout pane
- Tab controls in the Layout pane
- Margin and tab-related tasks
- Text glyphs
- Find and replace text
- Apply filters to text
- Chapter 17: Animated text
- Animated text overview
- Text animation behaviors
- Sequence Text behavior
- Scroll Text behavior
- Text Tracking behavior
- Type On behavior
- Preset Text Sequence behaviors
- Save a modified text behavior to the Library
- Use behaviors to animate text in 3D
- Animate text with keyframes
- Animate with the Transform Glyph tool
- Add nontext behaviors to text
- Chapter 18: Generators
- Chapter 19: Filters
- Filters overview
- Browse and preview filters
- Apply and remove filters
- Filter performance considerations
- Filters and cropping
- Adjust filters
- Animate filter parameters
- Apply behaviors to filter parameters
- Publish filter parameters and onscreen controls
- Manipulate alpha channels using filters
- Blur filters
- Border filters
- Color Correction filters
- Distortion filters
- Glow filters
- Sharpen filters
- Stylize filters
- Tiling filters
- Time filters
- Video filters
- Chapter 20: Shapes, masks, and paint strokes
- Shapes, masks, and paint strokes overview
- Draw simple shapes
- Add shapes from the Library
- Draw complex spline shapes and masks
- Edit shape fill, outline, and feathering
- Draw paint strokes
- Edit control points
- Edit control points overview
- Display control points
- Select and deselect control points
- Move control points to adjust a shape
- Modify shape edges
- Transform multiple control points
- Add and delete control points
- Lock control points
- Edit Bezier control points
- Edit B-Spline control points
- Use dynamic guides and snapping
- Shape parameters
- Edit shapes as layers
- Shape behaviors
- Keyframe the Shape Animation parameter
- Save shapes and shape styles
- Copy styles between shapes
- Masks and transparency
- Convert between shapes and masks
- Chapter 21: 3D compositing
- Chapter 22: Motion tracking
- Motion tracking overview
- How a tracker works
- Tracking behaviors
- Tracking workflows
- Adjust onscreen trackers
- Strategies for better tracking
- General tracking guidelines
- Basic strategies to improve tracking results
- Advanced strategies to improve tracking results
- Track perspective, scale, or rotational shifts
- Track obscured or off-frame points
- Track retimed footage
- Basic strategies to improve stabilization
- Remove black borders from stabilized clips
- Track groups
- Save tracks
- Tracking behavior controls
- Chapter 23: Audio
- Chapter 24: Share Motion projects
- Share Motion projects overview
- Share to Apple devices
- Share to iMovie, GarageBand, and other Apple applications
- Create a DVD, Blu-ray disc, AVCHD disc, or disk image
- Share to email
- Publish to video-sharing sites
- Export a QuickTime movie
- Export audio only
- Export an image sequence
- Export a still image
- Export for HTTP Live Streaming
- Export using Compressor
- Render settings
- Background rendering
- About Share Monitor
- Chapter 25: About rasterization
- Chapter 26: Video and file formats
- Chapter 27: Gestures
- Chapter 28: Keyboard shortcuts
- Keyboard shortcuts overview
- Enable function keys on portable Macintosh computers
- General interface commands
- Menu commands
- Audio list
- Tools
- Transport controls
- View options
- Miscellaneous
- HUD
- File Browser
- Inspector
- Keyframe Editor
- Layers
- Library
- Media list
- Timeline editing and navigating
- Keyframing commands
- Shape and Mask commands
- Toolbar
- 3D commands
- Use the Command Editor
Chapter 20 Shapes, masks, and paint strokes 874
•
Invert: A checkbox that inverts the attributes of the stroke created by the behavior. For
example, if pen speed is set to aect the width of the stroke, thin areas of the stroke become
wide and wide areas become thin when the checkbox is selected.
Apply Pen Tilt
When you use a stylus to create paint strokes using the paint stroke tool, this behavior controls
the width, opacity, spacing, angle, or jitter of the paint stroke based on the tilt of the pen while
creating strokes.
Note: You can use a combination of Apply Pen Tilt shape behaviors to aect more than one
parameter (such as Opacity, Width, or Jitter) of the stroke using the same tilt data.
Parameters in the Inspector
•
Apply To: A pop-up menu that sets how your paint stroke is aected by the tilt of your pen as
you draw. There are ve options:
•
Width: The tilt of the stylus aects the width of the stroke. The greater the tilt, the wider
the stroke.
•
Opacity: The tilt of the stylus aects the opacity of the stroke. The greater the tilt, the more
opaque the stroke.
•
Spacing: The greater the tilt of the stylus, the greater the spacing between stroke dabs.
•
Angle: The greater the tilt of the stylus, the larger the value of the angle of the stroke.
•
Jitter: The greater the tilt of the stylus, the larger the amount of jitter on the stroke. Jitter
randomizes the position of the paint dabs so they appear more like particles.
•
Calculate Tilt: A pop-up menu that sets how the tilt of the stylus aects the stroke. Pen tilt is
measured on two axes: X and Y. X represents the stylus tilting to the right and left (toward the
right or left side of the tablet); Y represents the stylus tilting up and down (toward the top or
bottom of the tablet). There are ve menu options:
•
Absolute: Takes the maximum tilt from any axis.
•
X Only: Measures the tilt only on the X axis.
•
Y Only: Measures the tilt only on the Y axis.
•
Axis: Makes the Tilt Axis parameter (described below) available.
•
Polar: Uses the tilt of the stylus as if it were an angle. When viewed from above, the stylus
points in a specic direction. That angle represents a polar value.
•
Tilt Axis: A dial and value slider, available when Calculate Tilt is set to Axis, that denes the axis
along which the tilt is measured.
•
Min Tilt: Adjusts the minimum threshold of tilt sensitivity. Tilt values below the minimum value
are remapped to 0. For Opacity and Width, those remapped values do not appear. For Spacing,
Angle, and Jitter, the values are not modied. If the Min and Max tilt are plotted on a graph,
Min Tilt represents the minimum value, or 0. The area of the graph between Min and Max is
remapped to the output values.
•
Max Tilt: A slider that adjusts the maximum threshold of tilt sensitivity. Tilt values above the
maximum value are remapped to 1. For Opacity, Width, Spacing, Angle, and Jitter, those values
will have the greatest eect. If the Min and Max tilt are plotted on a graph, Max Tilt represents
the maximum value, or 1. The area of the graph between Min and Max is remapped to the
output values.
67% resize factor