Introduction The Newton Works graphing calculator program lets you perform calculations and display the results in a graph or table. You can copy and paste the calculations or graph into other programs using Newton Works commands. To learn about Newton Works, see the chapters on Newton Works in the Apple eMate 300 User ’s Manual. Creating a new document for calculations To create a new document in which to do calculations, do the following from inside Newton Works: 1 Tap New.
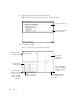
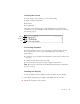
3 If desired, type in a title for the calculation document. Note: This title doesn’t appear when you print a calculation document. If desired, type a title here. When you’re finished, tap here or press Return. 4 Press Return or tap X. Here’s an example of a typical calculation document. Enter the calculations in the math window. If you plot the calculation, it appears here. View the output in tabular format.
Setting preferences You can set preferences for the graphing calculator. You can choose the default measurement to use for angles and the default number format. You can enter numbers in the way they’re typically expressed, with digits to the left and right of the decimal. For example, 123.4567 –4.32 You can also enter scientific or engineering notation. For example, 1.
Chapter 1 3 Tap u Number Format and in the list that appears, tap your choice. 4 If you choose Scientific or Engineering, tap u Significant Figures and in the list that appears, tap your choice. 5 If you choose Fixed, tap u Decimal Digits and in the list that appears, tap your choice for the number of digits you want after the decimal point.
To change the number format for the open calculation document follow these steps: 1 Tap Tools, then tap u Number Format. 2 Tap u Number Format and in the list that appears, tap your choice. 3 If you choose Scientific or Engineering, tap u Significant Figures, then tap the number of significant digits to be displayed. 4 If you choose Fixed, tap u Decimal Digits and in the list that appears, tap your choice for the number of digits you want after the decimal point.
x y z is interpreted as x multiplied by y, then that product multiplied by z. Use parentheses to avoid ambiguity about the order of calculations. The expressions in parentheses are solved first. For example, if you type: 3*(4+6) then the calculation 4 + 6 will be performed first. For more information, see “Order of Evaluation,” next. Order of evaluation The graphing calculator evaluates calculations in the following order: m Calculations inside parentheses.
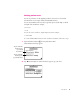
Viewing the results To see the results of your calculation, do one of the following: m Tap Tools and then tap Evaluate. m Press Enter. m Press x-Return. The results of your calculation appear. A checkmark appears at the right of the calculation area if you are defining a variable or function. If any errors are found, an error message appears. function calculation error Correcting mistakes If you make a mistake, you can correct it by doing one of the following.
Saving a calculation document Like other Newton Works documents, your calculation document is automatically saved as you enter information. There is no save command or button. For more information on Newton Works, see the chapters on Newton Works in the Apple eMate 300 User ’s Manual. Filing a calculation document If you are using the full Newton System, you can file calculation documents into folders using the Folder button.
Viewing your calculation documents You may want to see a list of all the calculation documents you created, especially if you’re trying to find a particular document. m To see a list of items press Overview. An overview appears. This symbol represents calculation documents. m Press Scroll Up or Scroll Down or the Up and Down Arrow keys on your keyboard to move up and down in the list. m If desired, tap an item in the list to go to it.
2 Using Functions and Variables This chapter describes how to use the built-in functions of the graphing calculator and how to create your own functions and variables. Using the built-in functions The graphing calculator has several built-in functions that you can use with your calculations. These functions are grouped as follows: m Integer m Math m Trigonometry m Series m Hyperbolic m Financial You can enter functions by typing function names on the keyboard or by selecting the functions from a list.
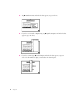
To use any of the built-in functions, do one of the following: m Type the function name on the keyboard, or 1 Tap Tools, and then tap Functions. The function slip appears. (Your slip may not look exactly like the illustration.) Tap the function category you want. 2 Tap the diamond u at the top of the slip. 3 In the list that appears, tap the type of function you want (Integer, Math, Trig, Series, Hyperbolic, Advanced, or Financial). Functions of that type are shown. Functions appear in this area.
4 Tap the function that you want to use in your calculation, then tap Insert. The function appears and the caret is placed between the parentheses. 5 If desired, tap X to close the function slip. 6 Enter the arguments for the function.
Using the math functions The Math list contains the following functions: Function Abbreviation Description Square Root Sqrt(x) Returns the square root of x Natural logarithm Ln(x) Returns the natural logarithm of x Exponential Exp(x) Returns the exponential (inverse of the natural logarithm) of x Gamma Gamma(x) Returns the gamma of x (Factorial(x – 1) for positive integers) Logarithm Log(x) Returns the logarithm of x, base 10 Modulus Mod(x,y) Returns the modulus of x with respect to y (
Using the trig functions The Trig list contains the following functions: Function Abbreviation Description Cosine Cos(x) Returns the cosine of x Sine Sin(x) Returns the sine of x Tangent Tan(x) Returns the tangent of x Arc cosine ArcCos(x) Returns the inverse cosine (arc cosine) of x Arc sine ArcSin(x) Returns the inverse sine (arc sine) of x Arc tangent ArcTan(x) Returns the inverse tangent (arc tangent) of x Examples 5cos(.
Using the series functions The Series functions perform operations on lists.
Using the hyperbolic functions The Hyperbolic list contains the following functions: Function Abbreviation Description Hyperbolic cosine CosH(x) Returns the hyperbolic cosine of x Hyperbolic sine SinH(x) Returns the hyperbolic sine of x Hyperbolic tangent TanH(x) Returns the hyperbolic tangent of x Hyperbolic arc cosine ArcCosH(x) Returns the inverse hyperbolic cosine of x Hyperbolic arc sine ArcSinH(x) Returns the inverse hyperbolic sine of x Hyperbolic arc tangent ArcTanH(x) Returns t
Using the financial functions The Financial list contains the following functions: Function Abbreviation Description Annuity Annuity(rate,periods) Returns the present value of an annuity (1 – (1 + r)^n)/r Compound Compound(rate,periods) Returns (1 + r)^n Examples Calculate your savings after two years if you deposited $3000 at 5.25% interest, compounded annually. 3000*compound(.0525,2) -> 3323.27 Calculate the current principal if you’ve made 12 payments of $320 at a rate of 8.5%. 320*annuity(.
x and t in the above examples are the function parameters. You specify the values for these parameters when you use the function in a calculation. For example, to evaluate the function z(x)=sqrt(16–x^2) with x = 2, type z(2) and press Enter. To create a function: m Enter the function and press Enter. If no errors are found, a checkmark appears to the right of your function and your function is added to the Your Functions list. Functions are saved automatically. There is no save command or button.
Creating parametric functions An example of a parametric function is shown below: x=t2, y=t–3 To enter parametric equations into the Newton Works graphing calculator, you can use the following format: x(t)=f(t) y(t)=g(t) p(t)=[x(t),y(t)] or p(t)=[f(t),g(t)] For example, using the above parametric equation, you can enter: x(t)=t^2 y(t)=t–3 p(t)=[x(t),y(t)] or p(t)=[t^2,t–3] You can graph parametric functions or view the results in tabular format, just like any other function.
Using your function To use your function, do one of the following: m Type the function name on the keyboard, or 1 Tap Tools, and then tap Functions. 2 Tap the diamond u at the top of the slip, then tap User Functions. 3 Tap the function that you want to use in your calculation, then tap Insert. The caret is placed between the parentheses. 4 Enter the arguments, if any, for the function.
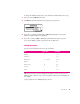
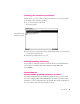
To use these constants, do one of the following: m Type the function name from the keyboard, or 1 Tap Tools, and then tap Functions. 2 Tap the diamond u, then tap Constants. 3 In the list that appears, tap the constant that you want to use in your calculation. Tap the constant you want to use. When you’re finished, tap here to insert the constant into the math window. 4 Tap Insert. Using variables A variable can represent a number, an expression, or a list.
2 Tap Tools, then tap Evaluate (or press Enter). Your variable is added to the User Variables list. Displaying the value of a variable To display the value of a variable, follow these steps: 1 Enter the variable name. 2 Tap Tools, then tap Evaluate (or press Enter). Changing the value of a variable To change the value of a variable, follow these steps: 1 Enter the variable name and its new value. 2 Tap Tools, then tap Evaluate (or press Enter or Return).
The graph variables and their default values are: Variable name Definition Default value xMin Minimum x value to display –12 xMax Maximum x value to display 12 xScl Increment between tick marks on the x axis 1 yMin Minimum y value to display –12 yMax Maximum y value to display 12 yScl Increment between tick marks on the y axis 1 tMin Minimum value for t in parametric functions 0 tMax Maximum value for t in parametric functions 99 tStep Increment between t values 1 thetaMin Min
Additional examples Find the range, mean, and standard deviation of these observations: 16,4,8,14,3,10,2,24,11,7,9 An object is released from rest and falls freely. Calculate its position and velocity after 1, 5, and 10 seconds. Take the origin 0 as the elevation of the starting point, the y-axis vertical, and the upward direction as positive. The initial coordinate and initial velocity are both negative. The acceleration is downward, or –32 ft/s2 position = v0t + .
A 32-lb. weight is attached to the lower end of a coil spring suspended from the ceiling. The weight comes to rest in its equilibrium position, stretching the spring 2 ft. The weight is then pulled down 5 in. below its equilibrium position and released at t = 0. No external forces are present; but the resistance of the medium in pounds is equal to 4(dx/dt), where dx/dt is the instantaneous velocity in feet per second. Plot the damped oscillatory motion.
3 Creating Graphs and Tables This chapter describes how to plot a function and view results in tabular format.
Or polar coordinates: To plot a function, follow these steps: 1 Create your function. See “Creating Your Own Functions” in Chapter 2. 2 Position the cursor on the line of the function you want to graph. 3 Tap Tools, then tap Graph or Graph Polar. A graph of your function appears. If you change a graphed function in the math window, the graph is updated automatically after you evaluate the function.
Plotting multiple functions on a graph You can plot multiple curves on a single graph. The graph icon next to the function shows the line style used to draw the curve associated with that function. Note: To plot multiple functions, make sure the functions have different names. To plot multiple curves, follow these steps: 1 In the math window, move the caret to the function you want to add to the graph. 2 Tap Tools, and then tap Graph or Graph Polar, depending on the graph you already have displayed.
Changing the zoom factor To change the level of detail in your graph, tap View and then tap Zoom In or Zoom Out. To zoom in to a particular section of a curve, draw a rectangle around that section. 1 Hold the pen where you want one corner of the rectangle, until you hear a beep. Note: Make sure the volume on your eMate is turned up so that you can hear the beep noise. 2 Drag the pen until the section of the graph you want to view is enclosed in the rectangle.
Changing the scale of an axis The Graph Variables define the scale of the axes for graphs. yMax xMin xMax yMin You can change these scales by entering new graph variables in the math window or the Scale slip. 1 Tap View, and then tap Scale. The Scale slip appears. Note: xMin must be less than xMax and yMin must be less than yMax. You can enter expressions with e or in the Scale slip. For example, you can set Max = 2.
If xScl or yScl are set to values that would generate too few or too many tick marks on the graph window, their default values are used. For more information on these variables, see “Graph and Table Variables” in the section “Using Variables” in Chapter 2. Viewing a point on the graph Tapping a curve marks that point with a box and displays the (x,y) values of that point. Use the left and right arrow keys on your keyboard to move the box to the left and right, respectively.
Moving around a graph After tapping a point on a curve (or any point on the graph), you can use the arrow keys on your keyboard to move around the graph. Pressing the arrow keys while holding down the Shift or x key moves the box or X in larger increments. Closing graphs To close the graph window: m Tap Graph, then tap Close Graph. To remove a curve from the graph, follow these steps: 1 In the math window, tap the function you want to remove from the graph (or tap the line in the graph window).
You can display multiple functions in a table. m In the math window, move the caret to the function you want to add to the table. Tap Tools, and then tap Table. Moving through the table To scroll through a table, tap any entry in the table and press the Up or Down Arrow keys on your keyboard. Pressing the arrow keys while holding down the x key moves in larger increments. Press the Left or Right Arrow keys to move from one function to the next.
Changing the table scale The tblStart, tblStop, and tblDelta system variables define the initial table view. You can change these variables in the math window. For example: tblStart=10 tblStop=15 tblDelta=.25 Note: tblStop is used only in printing or copy-and-drag operations. You can scroll beyond the tblStart and tblStop values in the table window. Closing a table To close the table window: m Tap Tools, then tap Close Table.
4 Creating and Using Lists You can use lists to provide values for function arguments and to store and manipulate data. This chapter describes how to create and use lists in your calculations and functions. Creating lists To create a list, type a series of numbers separated by commas and enclosed in square brackets. You can enclose lists within lists and place functions in lists.
Performing operations on lists You can perform any operation on a list of numbers. If multiple lists are used in an operation, they must be the same length. The following are some examples of simple operations done with lists: Operation Example Result Addition [1,2] + 3 [4,5] [1,2] + [3,4] [4,6] 3 + [1,2,[3,4]] [4,5,[6,7]] [1,7,1] – [2,3,1] [–1,4,0] [6,7] – 3 [3,4] 3 * [4,5] [20,25] [1,2,[3,4]] * [4,5,6] [4,10,[18,24]] [3,4,5]/2 [1.5,2,2.5] [4,5,6]/[2,3,4] [2,1.6667,1.
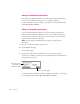
Graphing lists You can use lists to graph a family of curves. Use one of the following formats for the list: m [[x1,y1,x2,y2,x3,y3...] m [[x1,y1],[x2,y2],[x3,y3],...] m [[x1,x2,x3,...],[y1,y2,y3,...]] An example is shown below: An advantage of the format [[x1,x2,x3,...],[y1,y2,y3,...]] is that you can perform operations on the x and y coordinates independently.
Newton Works Graphing Calculator User’s Manual
K Apple Computer, Inc. © 1997 Apple Computer, Inc. All rights reserved. 1 Infinite Loop Cupertino, CA 95014-2084 408-996-1010 http://www.apple.com Every effort has been made to ensure that the information in this manual is accurate. Apple is not responsible for printing or clerical errors. Apple, the Apple logo, the Light bulb logo, Macintosh, and Newton are trademarks of Apple Computer, Inc., registered in the U.S. and other countries eMate is a trademark of Apple Computer, Inc.
Contents 1 Introduction 1 Creating a new document for calculations 1 Setting preferences 3 Using operators 5 Order of evaluation 6 Viewing the results 7 Correcting mistakes 7 Clearing the display 7 Saving a calculation document 8 Filing a calculation document 8 Viewing your calculation documents 9 Printing, beaming, and faxing 9 Reinstalling the Newton Works graphing calculator software 9 2 Using Functions and Variables 11 Using the built-in functions 11 Creating your own functions 18 Using constants
3 Creating Graphs and Tables Creating graphs 27 Creating a table 33 4 Creating and Using Lists Creating lists 37 Performing operations on lists 38 Using variables with lists 38 Graphing lists 39 iv Contents 37 27