
Manual

Plotting multiple functions on a graph
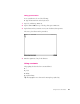
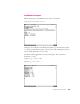
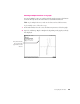
You can plot multiple curves on a single graph. The graph icon next to the function
shows the line style used to draw the curve associated with that function.
Note:
To plot multiple functions, make sure the functions have different names.
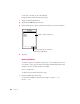
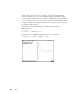
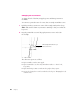
To plot multiple curves, follow these steps:
1 In the math window, move the caret to the function you want to add to the graph.
2 Tap Tools, and then tap Graph or Graph Polar, depending on the graph you already
have displayed.
Creating Graphs and Tables 29
T
h
i
s
s
y
m
b
o
l
s
h
o
w
s
t
h
e
l
i
n
e
s
t
y
l
e
u
s
e
d
i
n
t
h
e
g
r
a
p
h
w
i
n
d
o
w
f
o
r
t
h
i
s
f
un
c
t
i
o
n
.