
Owner manual


208 Chapter 9 Creating Charts
To show or hide axes and chart borders:
1 Select the chart.
2 In the Chart Inspector, click the Axis button if it is not already selected.
3 Choose one or more items from the Axes & Borders pop-up menu to select it.
A selected item has a checkmark next to it; choose the item again to deselect it.
To set the range of numerical values displayed on the chart grid:
1 Select the chart.
2 In the Chart Inspector, click the Axis button if it is not already selected.
3 To set the value at the chart origin, type a number in the Minimum field (under Value
Axis Format).
The Minimum value cannot be higher than the minimum value of your entire data set.
4 To set the highest number displayed on the value axis, type a number in the
Maximum field.
The Maximum value cannot be lower than the maximum value of your entire data set.
5 To specify the number of axis markings between the minimum and maximum values,
type a number in the Steps field.
To display the minimum data value on the value axis:
1 Select the chart.
2 In the Chart Inspector, click the Axis button if it’s not already selected.
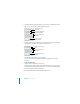
Set styles for labels
and tick marks along
the chart grid.
Select units for values in
the chart.
Show or hide axes and chart
borders (2D charts only).
Set the range of values
that appear on the chart
grid.