
Owner manual


214 Chapter 9 Creating Charts
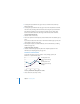
3 To change the space between bars, type a value (or click the arrows) in the “Gap
between bars” field.
4 To change the space between data sets, type a value in the “Gap between sets” field.
The value is the percentage of the bar thickness. Decreasing the space between the
bars makes them thicker. You can also move the pointer near a bar edge until it
becomes a double-headed arrow, then drag to make the bars thicker or thinner.
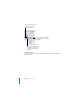
To put a shadow on each bar:
1 Select the chart or a data series.
2 In the Series pane of the Chart Inspector, choose Individual from the Shadow pop-up
menu.
If you select one data series and choose an item from the Shadow pop-up menu, the
choice applies to all series in the chart.
3 In the Graphic Inspector, set shadow attributes. (For more information, see “Adding
Shadows” on page 153.)
To adjust the opacity of a chart:
m Select the chart and drag the Opacity slider in the Graphic Inspector. For more
information, see “Adjusting Opacity” on page 154.
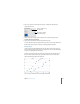
Area Charts and Line Charts
In area and line charts, you can use symbols—circles, triangle, squares, and
diamonds—to represent data points.
To use a symbol for the data points in a series:
1 Select a data series (area shape or line).
The data points in this
series are represented by
circles.
The data points in this
series are represented by
triangles.