
User's Manual


5
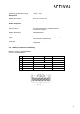
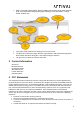
• Click on the “Start range profiles” button to display the sensors’ range profile external
GUIs. You should see a range profile graph showing on the “Red sensor – Range
Profile” window only.
• Two range profile windows are showing one for each sensor.
• The blue curve shows the range detection signal power in dB. Peaks with high power
levels shows detections along the x-axis representing the distance.
• The green curve shows the relative noise ratio.
3 Contact Information
Arrival Ltd.
Beaumont House
Kensington Village
Avonmore Road
London W14 8TS
United Kingdom
4 FCC Statements
This equipment has been tested and found to comply with the limits for a Class B digital device,
pursuant to part 15 of the FCC Rules. These limits are designed to provide reasonable protection
against harmful interference in a residential installation. This equipment generates, uses and can
radiate radio frequency energy and, if not installed and used in accordance with the instructions,
may cause harmful interference to radio communications. However, there is no guarantee that
interference will not occur in a particular installation. If this equipment does cause harmful
interference to radio or television reception, which can be determined by turning the equipment off
and on, the user is encouraged to try to correct the interference by one or more of the following
measures:
• Reorient or relocate the receiving antenna.
• Increase the separation between the equipment and receiver.
• Connect the equipment into an outlet on a circuit different from that to which the receiver is
connected.
• Consult the dealer or an experienced radio/TV technician for help.
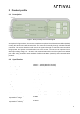
(1)
Select A1
RPS sensor
(2)
Select USRR mode
(default) in the
dropdown list
(3)
Select this button
to run the sensor
with the selected
(4)
Sensor activation
status is shown in
here
Clears the output
panel
(5)
Starts the
Rviz
visualizer
(6)
Starts Radars range
profile visualizers
Stops all
the
visualizers