TEMS™ VISUALIZATION BRIDGING THE OPTIMIZATION GAP
TEMS™ VISUALIZATION 7.2 PROFESSIONAL SEE YOUR NETWORK IN A WHOLE NEW WAY TEMS Visualization Professional is revolutionizing the way network operators troubleshoot their networks, enabling them to find problems that were impossible to pinpoint before. TEMS Visualization Professional provides this ability by analyzing event-based data generated by the infrastructure.
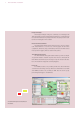
TEMS™ VISUALIZATION 7.2 PROFESSIONAL Call Event Analyzer The Call Event Analyzer makes every call within the recorded cell set available for detailed analysis. It allows the operator to see the major events associated with a particular call in a history view. Using powerful filtering and sorting functions, it displays the flow of handovers as either an event list or plotted on a map. Calls with abnormal events (dropped, blocked, handover failure, etc.) are easily identified.
TEMS™ VISUALIZATION 7.2 PROFESSIONAL Exception Analysis The Exception Analysis view gives a summary of all messages and TEMS Visualization Professional-generated events that occurred during all the calls in the database. Any exceptional events can quickly be sent to the Call List for investigation in more detail. Measurement Result Viewer The Measurement Result Viewer allows the user to see the common radio measurements for a call in a set of XY line graphs.
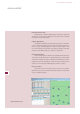
TEMS™ VISUALIZATION 7.2 PROFESSIONAL WCDMA SUPPORT Radio performance charts Measurements of signal strength, quality, and power in uplink and downlink can be displayed in distribution and scatter charts for detailed investigation of radio performance. Neighbor Optimization The Neighbor Optimization feature allows the operator to simultaneously look at missing neighbors as reported by actual users as well as statistics on usage of existing neighbors in order to optimize neighbor relations.
TEMS™ VISUALIZATION 7.2 PROFESSIONAL GSM SUPPORT IRAT Analysis The IRAT Analysis feature brings together information from the different GPEH events related to IRAT for further analysis. Each occurrence of IRAT activity can be followed all the way from the initial measurements on GSM until its conclusion. Cell Timeslot Monitor The Cell Timeslot Monitor allows the operator to view all the timeslots of all the channels allocated to a cell/sector in a pictorial view.
TEMS™ VISUALIZATION 7.2 PROFESSIONAL Reports Cell performance reports for both GSM and WCDMA provide a wide array of useful information, and reports are available for antenna and speech quality measurements in GSM. Summary reports for both GSM and WCDMA present key performance indicators for entire databases. Configuration data handling Special import features make it possible to create a cell file directly from an OSS export file. Both CNAI and BulkCM formats are supported.
www.ascom.com/tems WCDMA module ▪ Ericsson WRAN P5-W10B with GPEH feature ▪ Ericsson OSS-RC with GPEH feature Tracing module ▪ Ericsson WRAN, UETR P5-W10B ▪ Ericsson GRAN, MTR R12-G10B ▪ Ericsson GRAN, CTR 06A-G10B A revolutionary solution TEMS Visualization Professional is ideal both for finding network problems on a cell-by-cell basis and for regional optimization. It also allows individual areas with poor performance to be identified, even in the midst of cells where performance is generally very good.