
User Guide


5TEMS™ VISUALIZATION 7.2 PROFESSIONAL
Radio performance charts
Measurements of signal strength, quality, and power in uplink and
downlink can be displayed in distribution and scatter charts for detailed
investigation of radio performance.
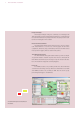
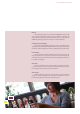
Neighbor Optimization
The Neighbor Optimization feature allows the operator to simultane-
ously look at missing neighbors as reported by actual users as well as sta-
tistics on usage of existing neighbors in order to optimize neighbor rela-
tions. This is linked to the map view for easy analysis. Changes can be made
and saved to a BulkCM format file for import into the OSS-RC.
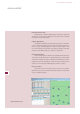
Pilot Pollution Detector
The Pilot Pollution Detector identifies cells suffering from Pilot Pollution.
The operator can then drill down for a detailed analysis of possible polluting
cells. The Pilot Pollution information is displayed as a detailed list, as well as
graphically on the map. Knowing the location and cause of pollution allows
operators to move quickly from identifying the problem to solving it.
Resource monitors
The Resource monitors allow the usage of resources to be analyzed.
Quantities such as power, channel elements, ASEs, and more can be plotted
in time or distribution graphs.
Neighbor Optimization view.
WCDMA SUPPORT