
User Guide


6 TEMS™ VISUALIZATION 7.2 PROFESSIONAL
IRAT Analysis
The IRAT Analysis feature brings together information
from the different GPEH events related to IRAT for further
analysis. Each occurrence of IRAT activity can be followed
all the way from the initial measurements on GSM until its
conclusion.
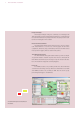
Cell Timeslot Monitor
The Cell Timeslot Monitor allows the operator to view
all the timeslots of all the channels allocated to a cell/sector
in a pictorial view.
▪ Users can browse through each state (change in the slot
usage for any channel) for the selected cell and monitor
the content of each event; for example, signal strength
of UE.
▪ Each TRU has a frame that will show each timeslot color
coded and by use (AMR, HR, FR, EFR, etc.).
Among many other benefits, this allows the operator to
▪ Dynamically show what actually happened when FR
channels started to load the cell and dynamic HR
adaptation stepped in.
▪ Provide input for multi-band cell optimization
(LOL-TAOL-DTCB-SCLD).
The Cell Timeslot Monitor also includes a load factor,
which makes it easy to identify when the cell had a heavy
load. This is very useful when analyzing the channel alloca-
tion algorithms. The Cell Timeslot Monitor also captures
statistics for dropped calls and handover failures on both
the TRU and the timeslot level. This can be used to easily
find hardware that is not working properly.
Estimated positioning
It is possible to display estimated positions of mea-
surement results and TEMS Visualization Professional
events. This information can be used to identify where cells
are covering too far and also gaps in WCDMA coverage
(from positioning of incoming intersystem handover events).
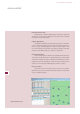
Binned maps
When estimated positions have been calculated, one
or more databases can be loaded into the tool and binned
maps created. These present not predictions but rather the
actual conditions as experienced by the live traffic in the
network. Binned maps can be created for signal strength,
interference, speech quality, traffic density, and TCH dropped
calls. A typical use case would be using the traffic density
maps to determine the advisability of investing in a new
site in areas of poor signal strength.
Faulty equipment analysis
Statistics are given per cell for non-air interface-related
dropped calls (i.e. dropped calls due to transmission problems
can be immediately identified and dispatched to the correct
department). Performance statistics are also given down to
TX and RX level and then graphs of radio performance per TX
or RX can be presented for more detailed analysis.
Tracing module
Tracing for both GSM and WCDMA using MTR and UETR
makes it possible to analyze calls in both WCDMA and GSM
in the same database, a feature unique to TEMS Visualization
Professional. Also, for GSM the CTR format from the OSS-RC
is now supported. Calls passing through a specific cell (up
to 16 at a time) can be recorded and the resulting CTR file
analyzed, making it possible to investigate the performance
for a single cell in great detail.
Task Manager
Handling of OSS data is automated to improve effi-
ciency when working with TEMS Visualization Professional.
Tasks include connection to different OSS or other FTP serv-
ers, downloading of OSS data such as recordings and con-
figuration files, parsing of data into databases and cell files,
archiving of old records for ease of use and storage, sched-
uling of all these tasks to automate the otherwise manual
work, cleanup of old file download history and error mes-
sages, and deletion or saving of old data.
GSM SUPPORT