
User guide

Method Basics
A transformer consists of multiple capacitances, inductances
and resistors, a very complex circuit that generates a unique
fingerprint or signature when test signals are injected at
discrete frequencies and responses are plotted as a curve.
Capacitance is affected by the distance between conductors.
Movements in the winding will consequently affect
capacitances and change the shape of the curve.
The SFRA method is based
on comparisons between
measured curves where
variations are detected. One
SFRA test consists of multiple
sweeps and reveals if the
transformer’s mechanical or
electrical integrity has been
jeopardized.
Practical Application
In its standard application, a
“finger print” reference curve
for each winding is captured
when the transformer is new
or when it is in a known good condition. These curves
can later be used as reference during maintenance tests or
when there is reason to suspect a problem.
The most reliable method is the time based comparison
where curves are compared over time on measurements
from the same transformer. Another method utilizes type
based comparisons between “sister transformers” with
the same design. Lastly, a construction based comparison
can, under certain conditions, be used when comparing
measurements between windings in the same transformer.
These comparative tests can be performed 1) before and
after transportation, 2) after severe through faults 3) before
and after overhaul and 4) as diagnostic test if you suspect
potential problems. One SFRA test can detect winding
problems that requires multiple tests with different kinds of
test equipment or problems that cannot be detected with
other techniques at all. The SFRA test presents a quick and
cost effective way to assess if damages have occurred or if
the transformer can safely be energized again. If there is a
problem, the test result provides valuable information that
can be used as decision support when determining further
action.
Having a reference measurement on a mission critical
transformer when an incident has occurred is, therefore, a
valuable investment as it will allow for an easier and more
reliable analysis.
Analysis and Software
As a general guideline, shorted turns, magnetization and
other problems related to the core alter the shape of the
curve in the lowest frequencies. Medium frequencies
represent axial or radial movements in the windings and
high frequencies indicate problems involving the cables
from the windings, to bushings and tap changers.
FRAX 150
Sweep Frequency Response Analyzer
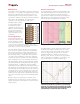
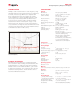
An example of low, medium and high frequencies
The figure above shows a single phase transformer after a service
overhaul where, by mistake, the core ground never got connected (red),
and after the core ground was properly connected (green). This potential
problem clearly showed up at frequencies between 1 kHz and 10 kHz and
a noticeable change is also visible in the 10 kHz - 200 kHz range.
The FRAX Software provides numerous features to allow
for efficient data analysis. Unlimited tests can be open
at the same time and the user has full control on which
sweeps to compare. The response can be viewed in
traditional Magnitude vs. Frequency and/or Phase vs.
Frequency view. The user can also choose to present the
data in an Impedance or Admittance vs. Frequency view
for powerful analysis on certain transformer types.