
User Manual


40
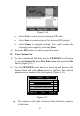
2) View live PIDs on the screen. Use the UP/DOWN scroll button
for more PIDs if additional information is available on more than
one page ( Figure 6.12).
Figure 6.12
If the “Graphics” on the bottom appears when a PID is
highlighted, graphic information is available. Select
Graphics to view graph (Figure 6.13). PID name, current
value, maximum and minimum values are displayed on the
screen.
Figure 6.13
If the “Merge Graph” on the bottom appears when a PID is
selected to view, merged graph information is available
(Figure 6.14).
NOTE: Merge Graph can be used to compare two related
parameters in graphic mode, which is especially convenient in
the Custom List option where you could select two interacted
parameter to merge and see their relationship.
Complete List
Numbers of DTCs
0
Fuel system 1 status
OL
Fuel system 2 status
--
Calculated load value
0.0
%
Engine coolant
temperature
-40
0
C
Pause Graphics Save