
User Manual


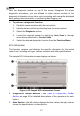
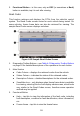


Table Of Contents
- Trademarks
- Copyright Information
- Disclaimer of Warranties and Limitation of Liabilities
- For Services and Support
- Safety Information
- Safety Messages
- Safety Instructions
- 1 Using This Manual
- 2 General Introduction
- 3 Getting Started
- 4 Diagnostics
- 5 MaxiFix
- 6 Shop Manager
- 7 Data Manager
- 8 Settings
- 9 Update
- 10 Support
- 11 Academy
- 12 Remote Desk
- 13 Quick Link
- 14 Function Viewer
- 15 Maintenance and Service
- 16 Compliance Information
- 17 Warranty

30
1. Diagnostics Toolbar Buttons – tap the drop-down button at the top center
of the screen and the toolbar buttons will display. See Table 4-2
Diagnostics Toolbar Buttons on page 20 for detailed descriptions of the
operations for each button.
2. Main Section
Name Column – displays the parameter names.
a) Check Box – tap the check box on the left side of the parameter
name to make selection of an item. Tap the check box again to
deselect the item.
b) Drop-down Button – tap the drop-down button on the right side
of the parameter name opens a submenu, which provides
various choices for data display mode.
Value Column – displays the values of the parameter items.
Unit Column – displays the unit for the parameters.
To change the unit mode, tap the Setting button on the top
toolbar and select a required mode. See Unit on page 68 for
more information.
Display Mode
There are 4 types of display modes available for data viewing, allowing
you to view various types of parameters in the most suitable way.
Tapping the drop-down button on the right side of the parameter name
opens a submenu. There are 4 buttons to configure the data display
Figure 4-14 Sample Live Data Screen