
User Manual
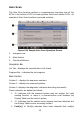
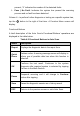
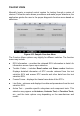
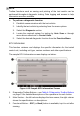
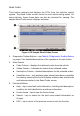
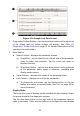
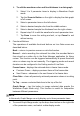
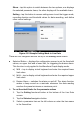
Table Of Contents
- Trademarks
- Copyright Information
- Disclaimer of Warranties and Limitation of Liabilities
- For Services and Support
- Safety Information
- Safety Messages
- Safety Instructions
- 1 Using This Manual
- 2 General Introduction
- 3 Getting Started
- 4 Diagnostics
- 5 MaxiFix
- 6 Shop Manager
- 7 Data Manager
- 8 Settings
- 9 Update
- 10 Support
- 11 Academy
- 12 Remote Desk
- 13 Quick Link
- 14 Function Viewer
- 15 Maintenance and Service
- 16 Compliance Information
- 17 Warranty

33
To edit the waveform color and line thickness in a data graph
1. Select 1 to 3 parameter items to display in Waveform Graph
mode.
2. Tap the Zoom-in Button on the right to display the data graph
in full screen.
3. Select a parameter item on the left column.
4. Select a desired sample color from the middle column.
5. Select a desired sample line thickness from the right column.
6. Repeat step 3-5 to edit the waveform for each parameter item.
7. Tap Done to save the setting and exit, or tap Cancel to exit
without saving.
3. Functional Buttons
The operations of available functional buttons on Live Data screen are
described below:
Back – returns to previous screen or exits the function.
Record – starts recording the retrieved live data; the recorded data is
then stored as a video clip in the Data Manager application for future
review. This function can be triggered automatically at preset threshold
value or values may be set manually. The triggering mode and record
duration can be configured in the Setting mode of Live Data.
Freeze frame – displays the retrieved data in freeze frame mode.
Previous Frame – displays previous frame of the freeze data.
Next Frame – advances to the next frame in the freeze data.
Clear Data – clears all previously retrieved parameter values at a cutting
point.
To Top – moves a selected data item to the top of the list.
Graph Merge – tap this button to merge selected data graphs (for
Waveform Graph Mode only). This function is useful for comparison
between different parameters.
NOTE
In this mode, Graph Merge can only display up to three parameter items.
To cancel Graph Merge mode, tap the drop-down button on the right side
of the parameter name, and select a data display mode.