
User Manual
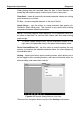
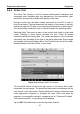
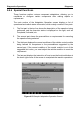
Table Of Contents
- Trademarks
- Copyright Information
- Disclaimer of Warranties and Limitation of Liabilities
- For Services and Support:
- Safety Information
- Contents
- Chapter 1 Using This Manual
- Chapter 2 General Introduction
- Chapter 3 Getting Started
- Chapter 4 Diagnostics Operations
- Chapter 5 Data Manager Operations
- Chapter 6 MaxiFix Operations
- 6.1 Navigation
- The Header
- Select Vehicle Button
- The “Select Vehicle” button on the Header allows you to specify the vehicle which you want to reference on MaxiFix, by selecting each of the vehicle attribute from a sequence of option lists. This feature helps to filter out the searches that allow on...
- 6.1.1 Terminology
- 6.2 Operations
- 6.1 Navigation
- Chapter 7 Settings Operations
- Chapter 8 Shop Manager Operations
- Chapter 9 Update Operations
- Chapter 10 Support Operations
- Chapter 11 Training Operations
- Chapter 12 Remote Desk Operations
- Chapter 13 Quick Link Operations
- Chapter 14 Maintenance and Service
- Chapter 15 Compliance Information
- Chapter 16 Warranty

Diagnostics Operations Diagnosis
36
information.
3. Display Mode
There are 4 types of display modes available for data viewing, allowing
you to view various types of parameters in the most suitable way.
Tapping the drop-down button on the right side of the parameter name
opens a s ubmenu. There are 4 but tons to configure the data display
mode, and one Help button on the right that you can tap for additional
information.
Each parameter item displays the selected mode independ en tl y.
Analog Gauge Mode – displays the parameters in form of an analog
meter graph
Text Mode – this is the default mode which displays the parameters in
texts and shows in list format
NOTE: Reading of status parameters, such as a switch reading, which
are mostly in word form, like ON, OFF, ACTIVE, and ABORT, etc., can
only be displayed in Text Mode. Whereas reading of value parameters,
such as a sensor reading, can be displayed in text mode and other graph
modes.
Waveform Graph Mode – displays the parameters in waveform graphs
When this mode is applied, three control buttons will appear on the right
side of the parameter item, allowing you to manipulate the display status.
Text Button – resumes Text Display Mode
Scale Button – changes the scale values, which are displayed
below the waveform graph. There are 4 scales available: x1, x2,
x4 and x8.
Zoom-in Button – tap once to display the selected data graph in
full screen
Digital Gauge Mode– displays the parameters in form of a digital gauge
graph
Full Screen Display – this option is only available in the waveform graph
mode, and mostly used in Graph Merge status for data comparison.
There are three control buttons available on t he top right side of the
screen under this mode.
Edit Button – tapping this button opens an edit window, on which
you can set the waveform color and the line thickness displayed
for the selected parameter item.