
User Manual


109
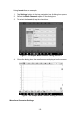
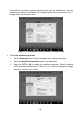
Figure 7-16 Sample XY View Setting Screen
In the Spectrum View, the waveform shows the signal level on a vertical axis against
frequency on the horizontal axis in a graphical way. One or more spectra with a
common frequency axis can be displayed in the spectrum view.
NOTE
The Wi-Fi connection does not support the XY View and Spectrum View. Please use
the USB cable to connect the device, instead of the Wi-Fi connection.
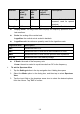
The spectrum-related analysis options display after selecting the spectrum view in
the Mode setting screen. Select the desired spectrum bins and window functions for
better spectrum analysis.
The amplitude overrange of Y-axis can be adjusted by the amplitude level. When the
sampling frequency is low, the current frequency can also be adjusted. The
maximum frequency supports 20M.