
User Manual


41
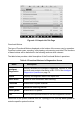
1. Diagnostics Toolbar Buttons – Tap the parallel icon at the top of the screen to display
diagnostics toolbar buttons. See
Table 4-2 Diagnostics Toolbar Buttons on page 32 for
detailed descriptions of the operations for each button.
2. Main Section
Name Column – this column displays the parameter names.
a) Check Box – tap the check box to the left of a parameter name to select the item.
Tap the check box again to deselect it.
b) Drop-down Button – tap the drop-down button on the right side of the parameter
name to open a submenu, which provides optional modes that display the data.
Value Column – displays the values of the parameter items.
Range Column – display the ranges of the parameter items.
Unit Column – displays the unit for the parameter values.
To change the Unit mode, tap the Setting button in the top toolbar and select a
required mode. See
Unit on page 245.
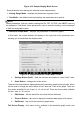
Display Mode
There are four types of display modes available for data viewing, allowing you to view
various types of parameters in the mode best suited to represent the data.
Tap the drop-down button on the right side of the parameter name to open a submenu.
A total of 7 buttons will be displayed: The 4 buttons to the left represent different data
display modes, plus one Information button, active when additional information is
available, and one Unit Change button, for switching the unit of displayed data, and one
Trigger button, tap to open the "trigger setting" window.