
User Manual


42
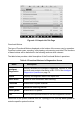
Figure 4-18 Sample Display Mode Screen
Each parameter item displays the selected mode independently.
Analog Gauge Mode – displays the parameters in gauge charts.
Text Mode – the default mode that displays the parameters as a text list.
NOTE
Status parameters, such as a switch reading like ON, OFF, ACTIVE, and ABORT can only
be displayed in Text Mode. Value parameters, such as a sensor reading, can be displayed
in both text and graph modes.
Waveform Graph Mode – displays the parameters in waveform graphs.
In this mode, five control buttons will display on the right side of the parameter item,
allowing you to manipulate the display status.
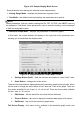
Figure 4-19 Sample Waveform Graph Mode Screen
1. Settings Button (SetY) – Sets the minimum and maximum value of the Y axis.
2. Scale Button – changes the scale values.
There are two scale buttons, displayed above the waveform graph to the right side, which
can be used to change the scale values of the X axis and Y axis of the graph. There are
four scales available for the X axis: x1, x2, x4 and x8. There are three scales available
for the Y axis: x1, x2, and x4.
3. Edit Button – edit the waveform color and the line thickness.
4. Zoom-in Button – tap once to display the selected data graph in full screen.
5. Exit Button – tap to exit the waveform graph mode.
Full Screen Display – this option is only available in the waveform graph mode, and