
User Manual


43
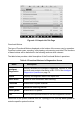
mostly used in Graph Merge status for data comparison. There are three control buttons
available on the top right side of the screen under this mode.
Scale Button – tap to change the scale values below the waveform graph. There
are four scales available for the X axis: x1, x2, x4 and x8. There are three scales
available for the Y axis: x1, x2, and x4.
Edit Button – tap to open an edit window, in which you can set the waveform color
and the line thickness displayed for the selected parameter item.
Zoom-out Button – tap to exit full screen display.
Exit Button – tap to exit the waveform graph mode.
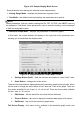
To edit the waveform color and line thickness in a data graph
1. Select parameter items to display in Waveform Graph mode.
2. Tap the Edit Button, and an edit window displays.
Figure 4-20 Sample Waveform Edit Screen
3. The parameter item is selected automatically in the left column.
4. Select a color from the second column.
5. Select a line thickness from the right column.
6. Tap Done to save the setting and exit, or tap Cancel to exit without saving.
NOTE
In full screen display, please edit the waveform color and line thickness by tapping the
Edit Button on the top right side of the screen.
Trigger Settings
On the trigger setting screen, you can set a standard range by filling in a Minimum value