
User's Manual

Chapter 3 Configuring and graphing ports 101
Reference for the Business Policy Switch 2000 Management Software Operations
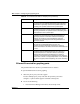
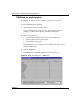
Graphing port statistics
You can graph statistics for either a single port or multiple ports from the
graphPort dialog box. The windows displayed are identical for either single or
multiple port configuration.
To open the graphPort dialog box for graphing:
1 Select the port or ports you want to graph.
To select multiple ports, [Ctrl] + left-click the ports that you want to
configure. A yellow outline appears around the selected ports.
2 Do one of the following:
• From the Device Manager main menu, choose Graph > Port.
• From the shortcut menu, choose Graph.
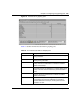
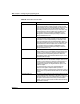
ServerTimeout Time to wait for a response from the RADIUS server
MaxReq Number of times to retry sending packets to the
supplicant.
ReAuthPeriod Time interval between successive re-authentications.
ReAuthEnabled Whether to re-authenticate or not. Setting this object to
Enabled causes reauthentication of existing supplicant at
the time interval specified in the Re-authentication
Period field.
KeyTxEnabled The value of the KeyTranmissionEnabled constant
currently in use by the Authenticator PAE state machine.
This always returns false as key transmission is
irrelevant.
LastEapolFrameVersion The protocol version number carried in the most recently
received EAPOL frame.
LastEapolFrameSource The source MAC address carried in the most recently
received EAPOL frame.
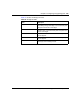
Table 36 EAPOL tab fields for multiple ports (continued)
Field Description